

We need to add two dynamic variables representing adoptions resulting from word of mouth and from advertising.
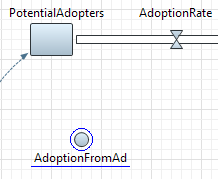
Create AdoptionFromAd dynamic variable
- Drag the
 Dynamic Variable element from the
 System Dynamics palette onto the graphical diagram of agent.
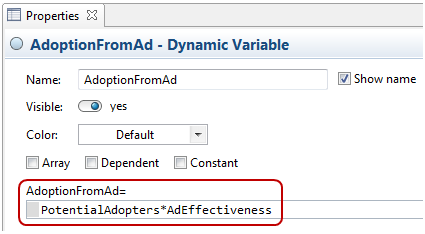
 - In the Properties view, change the Name to AdoptionFromAd.
Now we want to specify a formula for this dynamic variable. The formula for the adoption from advertising is AdEffectiveness*PotentialAdopters.
Add links from two variables to AdoptionFromAd
- Add a link from
 PotentialAdopters to AdoptionFromAd.
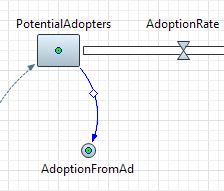
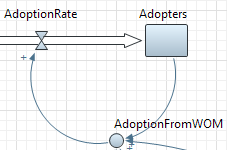
- You can adjust the link appearance (change its arc) by dragging the marker in the middle of the link. Adjust the appearance to make the link look like in the following figure:
 You may have noticed that this link looks different from the one drawn from
 TotalPopulation to
PotentialAdopters. Links to variables mentioned in stock initial values are drawn with dotted lines, while other links — with solid lines.
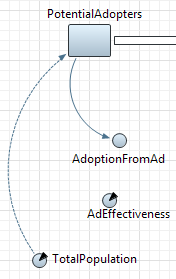
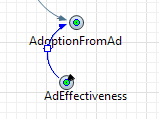
TotalPopulation to
PotentialAdopters. Links to variables mentioned in stock initial values are drawn with dotted lines, while other links — with solid lines. - Add one more link, going from AdEffectiveness to AdoptionFromAd.
- Now you can specify the formula in the properties of AdoptionFromAd (in the AdoptionFromAd = edit box): AdEffectiveness*PotentialAdopters
Create AdoptionFromWOM dynamic variable
- Add one more
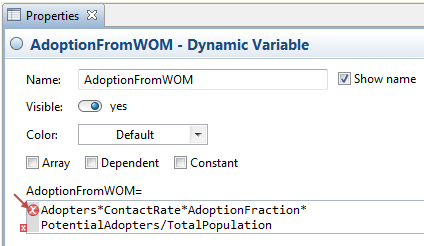
Dynamic Variable. Name it AdoptionFromWOM and specify the following formula:
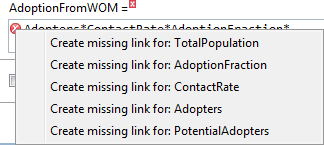
ContactRate*AdoptionFraction*PotentialAdopters*Adopters/TotalPopulationYou may find it boring to add numerous links for all the variables mentioned in this formula. For this case AnyLogic provides a quick fix mechanism that automatically creates missing links to the variables mentioned in an equation. - After specifying the given formula, click inside the formula field. You will see error indicators.
- Click the error indicator (right where the arrow points in the figure above). You will see the context menu with items Create missing link for: ContactRate, etc. Choose this item and the corresponding link from the
ContactRate parameter to AdoptionFromWOM will be created. Do the same things for all other missing links one by one.
- You can also fix dependency links using the context menu.
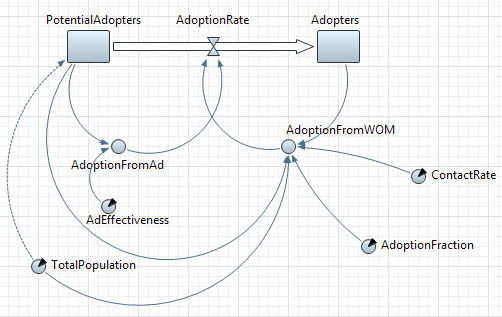
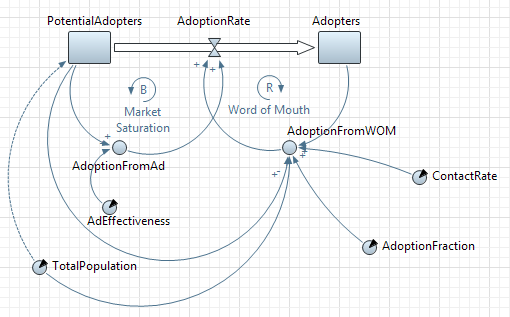
Finally you will get the following stock and flow diagram:
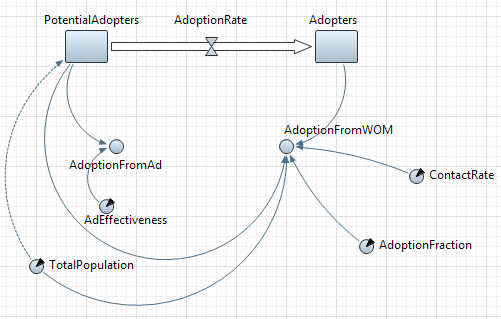
Now we can formulate the adoption flow using just defined dynamic variables. The two sources of adoption are assumed to be independent. Thus, the total adoption rate is the sum of adoptions resulting from word of mouth driven by the population of adopters and adoptions resulting from advertising.
Define the formula for the adoption rate
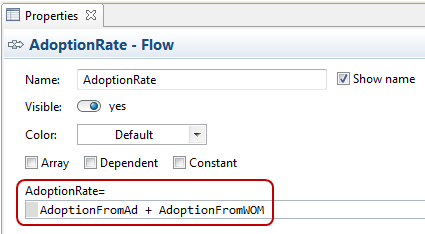
- We want to define the formula AdoptionFromAd+AdoptionFromWOM for the flow. First, add two links pointing from these variables to the flow.
- Now select the flow on the diagram and go to the flow properties. Specify the formula expression in the AdoptionRate= field: AdoptionFromAd+AdoptionFromWOM
Now we have completely defined our model. The stock and flow diagram of the model should look like as on the figure below.
The relationships between variables, represented by links, can be labeled as positive or negative.
- Positive causal link means that the two variables change in the same direction, i.e. if the variable in which the link starts decreases, the other variable also decreases. Similarly, if the variable in which the link starts increases, the other variable increases.
- Negative causal link means that the two variables change in opposite directions, i.e. if the variable in which the link starts increases, then the other variable decreases, and vice versa.
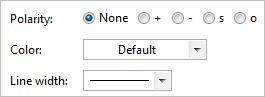
Polarity is usually indicated with a /- sign at the link arrowhead. You can add polarity labels for the links present in your stock and flow diagram.
Add polarity labels for links
TotalPopulation to AdoptionFromWOM. The difference between positive and negative links is described here.- To add a polarity sign, select the link in the graphical editor and choose + or - option from the Polarity group of options in the link’s Properties.
- You can change here the color of the link either (in the Color control).
Our model has one balancing and one reinforcing feedback loop.
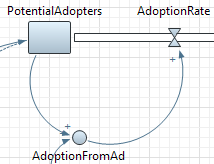
- A balancing feedback loop affects the adoption rate due to advertising. The adoption rate reduces the pool of the potential adopters, which in turn decreases the adoption rate.
- A reinforcing loop affects the adoption rate due to word of mouth. The adoption rate increases the adopter population, resulting in an increase of word of mouth, and thus the increase of the adoption rate.
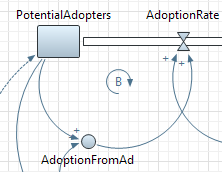
Add an identifier for Market Saturation loop
- Drag the
 Loop element from the
System Dynamics palette onto the graphical diagram, as shown in the figure below:
Loop element from the
System Dynamics palette onto the graphical diagram, as shown in the figure below:
- Go to the Properties view to set up properties of the loop.
- Set the Direction of this loop — this loop is Counterclockwise.
- Type the brief text explaining the meaning of this loop in the Text property: Market Saturation. This text will be shown on the presentation.
- Choose the symbol that will be shown for this element from the Type group of buttons. Choose B here (stands for Balancing) since this loop is balancing.
To determine if a causal loop is reinforcing or balancing, one can start with an assumption, e.g. "VariableN increases" and follow the loop around. The loop is:
- reinforcing if, after going around the loop, one ends up with the same result as the initial assumption.
- balancing if the result contradicts the initial assumption.
Add an identifier for Word of Mouth loop
- Add one more loop identifier as shown in the figure below:
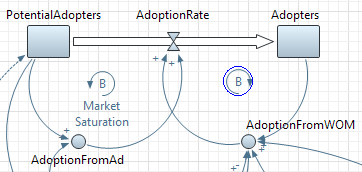
- This loop stands for word of mouth effect. It is reinforcing, so choose R as a symbol denoting its type.
- Specify Word of Mouth as its Text.
- Set the Direction of this loop — this loop is Clockwise.
Finally the diagram should look like in the figure below:
-
How can we improve this article?
-