

Since every AnyLogic model is essentially a Java application, it is useful to take a programming-like approach when designing a model. For example, if your model uses more memory than it should, it may slow down or even crash; this can happen due to memory leaks, where unneeded memory is not properly freed.
To identify such problems, AnyLogic includes the built-in model memory analyzer, which allows you to find memory leaks in your model and reduce memory consumption. It can be started during the model execution. Upon receiving the command to open the memory analyzer, AnyLogic gets the ID of the running model process, dumps it, and opens the editor to display it.
To open the memory analyzer
- Run the model.
- In the AnyLogic menu, select Model > Memory dump.
This will open the new tab in the editor that contains the memory snapshot of the running model.
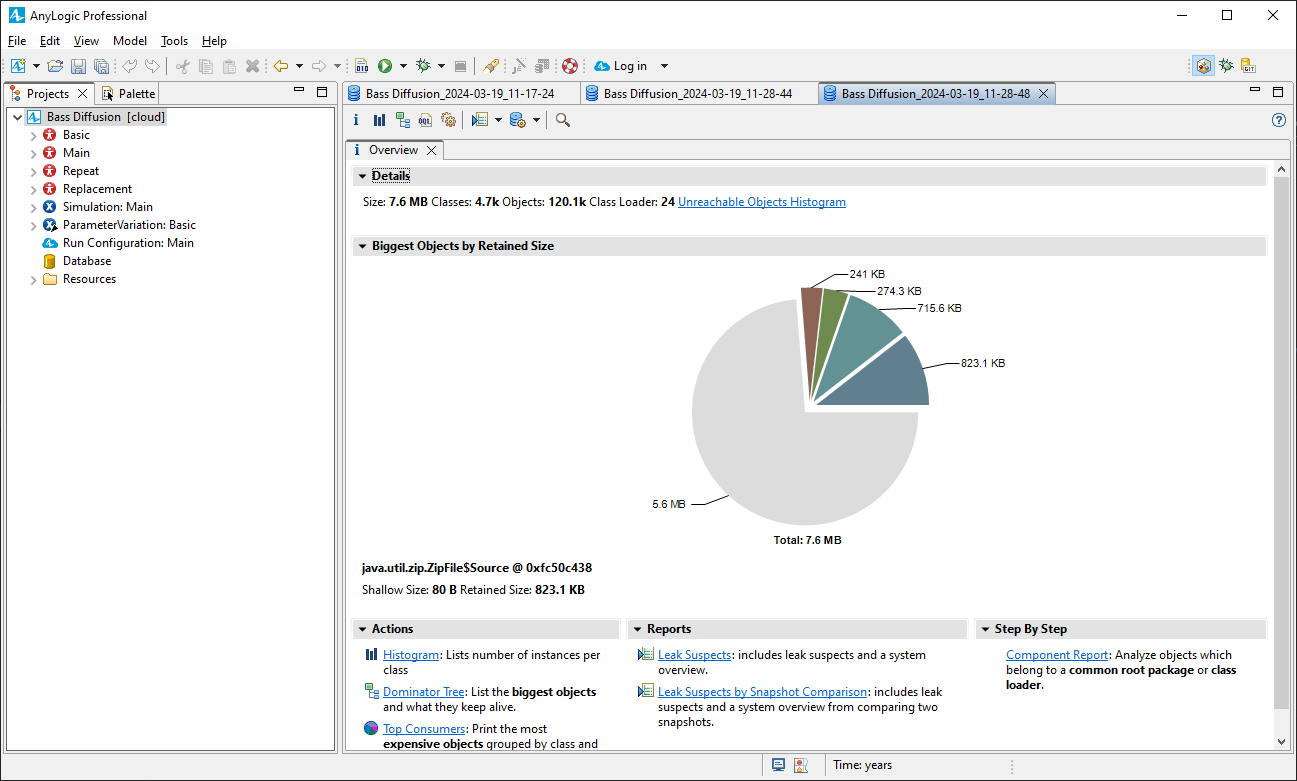
After running the memory analyzer, you will see the overview page.
The right side of the page shows the size of the memory dump, as well as the number of classes, objects, and class loaders. If the total size of the dump is much smaller than the size of the model JAR file, it is possible that the heap dump contained many garbage objects that would be discarded at the next garbage collection.
The chart shows the largest objects in the dump. Move your mouse over a slice to see the details of the objects. Click  to open the query browser to drill down and get more specific results.
There are a number of additional tools available for the memory analyzer: both from the overview toolbar and in the panes below.
-
Histogram — Lists the number of instances per class, their flat size (the memory consumed by each object), and the retained size (the memory consumed after the Java garbage collector performs the cleanup).
While viewing the histogram, you can also get more specific details about each object from the context menu.
In addition, the histogram allows you to group objects by class, class loader, package, or superclass. - Dominator tree — Displays the largest objects in the heap dump, including references to their dependent objects. The dependent objects are those that will be removed by the Java garbage collector if you remove references to them from their parent objects.
- Top consumers — Displays which classes, class loaders, and packages consume the most memory.
-
Leak suspect report — Identifies potential memory leaks. It starts with a dominator tree, where the largest items are examined first. If an item uses more than 10% of memory (where 10% is a default value), it could be a leak source. Sometimes, many small objects of the same type take up a lot of memory together, forming another type of leak. Each suspect is then analyzed further.
If the suspect is a thread, the report shows its call stack and relevant frames. If it’s a class loader or a class, the report marks it as a part of the model worth investigating. - Leak suspect report by snapshot comparison — Similar to the leak suspect report, but allows you to select an outer snapshot to act as a baseline. The two snapshots are then compared, and the potential leak source is highlighted.
 drop-down list.
- Component Report — Provides an overview of each component’s characteristics, details about its size, the number of classes, objects, and different class loaders. The report also highlights the largest objects, classes, class loaders, and packages held by the component, providing insight into what the component is keeping active.
The query browser is a tool available either from the toolbar (the drop-down list) or from the context menu of each summary pie chart segment.
It offers a number of options, all of which provide insights into different aspects of the memory snapshot:
- List Objects and Show Objects by Class provide organized view of the model elements.
- Path To GC Roots and Merge Shortest Paths to GC Roots are related to memory management and garbage collection.
- Java Basics and Java Collections provide means to manage Java-based objects.
- Leak Identification provides access to various utilities for identifying the memory leak, including but not limited to those described above.
-
How can we improve this article?
-