

AnyLogic supports a convenient way of collecting statistics for population of agents.
There are several statistics types supported:
- Count. Counts agents satisfying the specified Condition.
- Sum. Iterates through all agents and evaluates the specified Expression for each agent. Returns the sum of obtained values.
- Average. Iterates through all agents and evaluates the specified Expression for each agent. Returns average of obtained values.
- Min. Iterates through all agents and evaluates the specified Expression for each agent. Returns the minimum obtained value.
- Max. Iterates through all agents and evaluates the specified Expression for each agent. Returns the maximum obtained value.
Sum, Average, Min, and Max can be calculated only for those agents, who meet the optional Condition.
To define new statistics function for a population of agents
- Select the population element in the graphical editor or in the Projects view.
- Open the Statistics section of the Properties view.
-
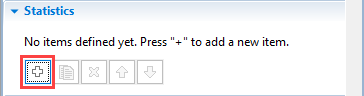
Click the
 Add statistics button to create a new section defining one statistics field.
- Edit the name of the statistics function in the Name field. This name is used to identify and access this statistics function.
- Choose the type of statistics function using the Type group of buttons.
- Specify Expression and/or Condition using the controls below. While writing code in these fields, you can access an individual element of a population (an agent) as agent.
-
To add more statistics fields, please repeat steps 3-6. If you do not need some statistics any more, you can remove the corresponding section by clicking the
 button.
The defined statistics is accessed in the "function" style: as statistics name followed with parenthesis.
Let's study the example to see how statistics functions are defined and used in the model.
Demo model: Kinship Model with Standard Statistics Open the model page in AnyLogic Cloud. There you can run the model or download it (by clicking Model source files). Demo model: Kinship Model with Standard StatisticsOpen the model in your AnyLogic desktop installation.In the given example model we show how to collect statistics in agent-based models using the standard statistics of the agent population. In this version of the Kinship model we count the number of juniors, male adults, female adults, and seniors, and the average number of kids in a family. We display the statistics using time stack chart and bar chart.
Here we have the people population with agents of the Person agent type. The Person agent has a statechart with Junior, Adult, and Senior states, and the gender is defined with the male parameter of boolean type.
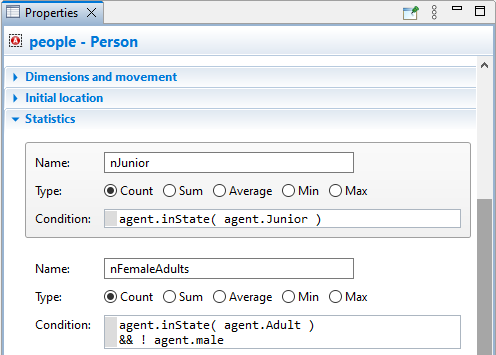
Open the Statistics section of properties of the people agent population (in the Main agent type), and you will see how the statistics function are defined.
The first function has the Count type. It counts the number of juniors, and for that we use the following Condition: agent.inState(agent.Junior). Precisely, this function counts all agents within the people population that are currently in the Junior state. Here we access agents using the local variable agent.
The second function counts female adults. This time the Condition is agent.inState( agent.Adult ) && ! agent.male. Here we check two conditions at once. We use the logical AND operation (&&) so that the condition returns true only if both conditions are true: the agent is currently in the Adult state and its boolean parameter male is not true.
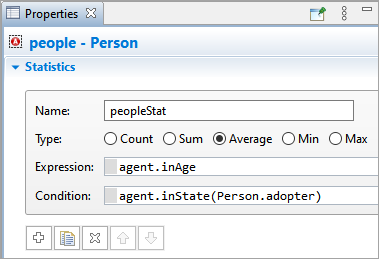
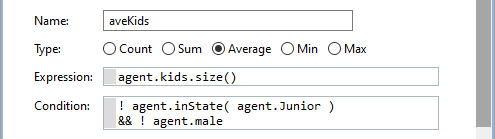
The last statistics function has the Average type. It returns the average number of kids in a family using the following Expression: agent.kids.size(). Note that we also have the additional Condition. It prevents us from counting the same number of kids twice - once for a wife and another time for her husband.
You can visualize the agent population statistics with charts.
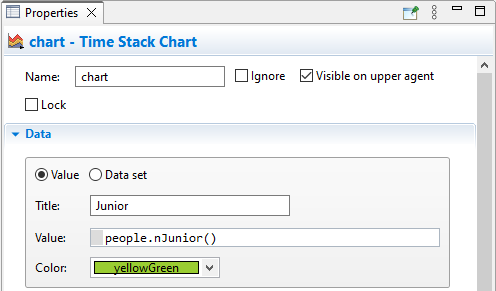
You can study the technique in the same demo model mentioned above. Here the collected statistics are visualized with the chart time stack chart. In the Data section of its properties, you can see the data items that correspond to the statistics functions. To visualize the statistics, you need to select the Value option and call the corresponding function in the Value field. Since the statistics functions belong to the population named people, here we use people as a prefix: people.nJunior(), people.nFemaleAdults(), people.nMaleAdults(), people.nSenior().
-
How can we improve this article?
-