

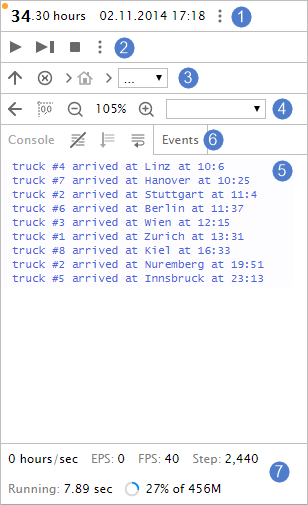
The developer panel provides access to the additional model controls, simulation data, the experiment output console, and the event queue. Use it to navigate through the running model, set its end time or date, analyze the data written to the console, and check the events queue of the AnyLogic simulation engine.
You can enable or disable the developer panel and specify whether it should be immediately displayed in the model window when you run the experiment. These settings are available either in the Window section of the experiment properties or can be specified at the model runtime programmatically. The functions you can use are described in the Developer panel section in Accessing the presentation.
|
The developer panel contains the following sections: |
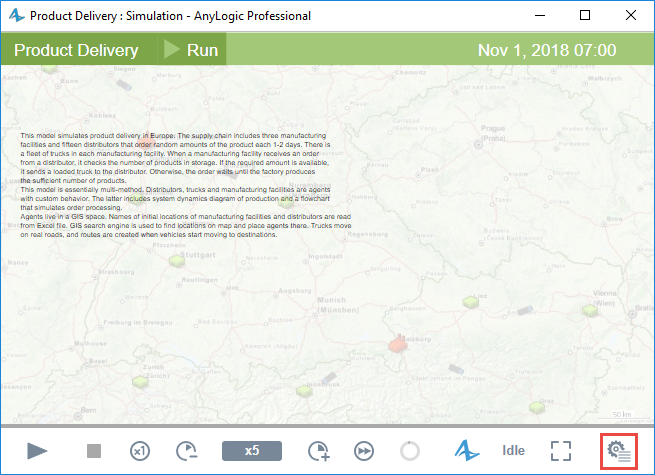
To open the developer panel
-
Run the model. In the model window, click the rightmost control Developer panel
 .
.
 .
.

-
 model status — Indicates the current status of the model:
-
 — The model is not launched.
-
 — The model is running.
-
 — The model is paused.
-
 — An error has caused the model to fail.
-
 — A model is being initialized or an uninterruptible command is being executed, such as pause(), step(), or stop().
-
 — The specified model run time has elapsed or there are no more events to execute, so the model has stopped running.
-
-
 model time — Displays the current model time (as the number of the model time units elapsed).
-
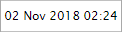 model date — Displays the current model date.
-
 show/hide snapshot options — Provides access to additional controls for saving/restoring the model state:
 restore saved snapshot — Loads the previously saved
  save snapshot — Saves the current model state to a file. Later, you can load the saved
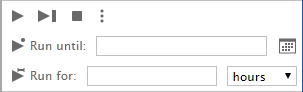
-
 run — [Visible if the model is not running] Runs the simulation. Starts the execution or, if the simulation was paused, resumes the simulation from the current state.
-
 step — [Visible if the model is not running] Makes the step. The model will run to the first change in the window and then pause.
-
 pause — [Visible only if the model is running] Pauses model execution when clicked.
-
 stop — Terminates the current model execution.
-
show/hide run options — Provides access to the additional model run parameters.
-
 run until — [Visible if the model is not running] Sets the date or time point at which the model execution will be paused.
-
 pause at — [Visible only if the model is running] Sets the moment of time at which the model execution will be paused.
-
 toggle date/time units — Specifies whether the model will be running until a certain date or for a certain time.
-
 run for — [Visible if the model is not running] Sets the duration of the model simulation. When the time elapses, the model is paused. If you click it again, the model will continue to run for the specified period of time from the moment it was paused. The amount of time you want the model to run may be different each time you start it. If you set the run for option to 2 days, the model will pause after 48 hours of model time. You can then set the model to run for 2 hours (that is, 2 additional hours). The model will now pause when 50 hours of model time have elapsed (the total of 2 days and 2 hours).
Defines the agent or experiment whose presentation should be displayed in the window.

-
 up one level — Navigates to the presentation of the parent (owner) of the currently displayed agent (for the top-level agent, this is the experiment start page). This button is disabled if the title page is currently displayed.
-
 to experiment (start page) — Opens the title page of the launched model. This button is disabled if the model window is currently displaying the title page.
-
 to top level (root) agent — Opens the presentation of the top-level agent of the launched model. This button is disabled if the model window is currently displaying the top-level agent.
-
 select agent to dive in — Provides the list of model agents to which you can navigate. The list contains the agents living in the currently selected agent. To navigate further down the model hierarchy, use the similar list shown to the right of this one.

-
 go back — Takes you one step back to the presentation you were viewing.
-
 to (0,0), zoom 1, same page [origin] — Restores the default presentation scale and origin.
-
 zoom out — Zooms out of the presentation.
-
 current zoom — Displays the current scale of the presentation. You can change the current zoom using the Zoom in and Zoom out buttons along the edges of this control.
-
 zoom in — Zooms in on the presentation.
-
 select view area to navigate — Opens the list of view areas. The user can select a view area from the drop-down list and the contents of the selected view area will be displayed in the model window.
The Console section of the developer panel displays the output of the execution of your model. The common way to write output to the console is to use the AnyLogic functions traceln() and trace().
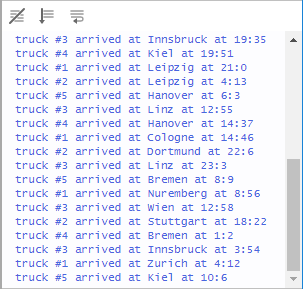
The console toolbar is used to manage the contents of the console:
-
 clear console — Clears the console. It deletes all the text currently displayed in the console.
-
 stay at the latest item — [Enabled if the content does not fit into the console area] Jumps to the latest line of the output and stays there. Scroll up the output to disable automatic scrolling.
-
 toggle line wrap — [Enabled by default] Wraps long text lines into multiple lines to fit the current size of the console. Click to disable line wrapping.
Events panel displays the event queue of AnyLogic simulation engine for the launched model. The user often works with the events panel using the Step command. The panel consists of two tabs:
-
 Event queue — displays currently executed events and events scheduled for execution at a particular time.
-
 Monitored conditions — displays events that do not have a scheduled execution time, since the execution of such an event is triggered by a condition.
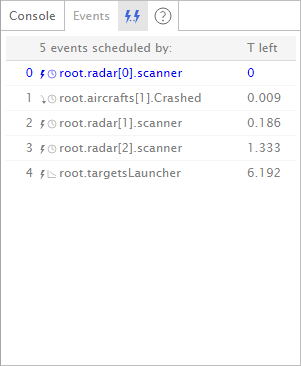 Events panel. Event queue.
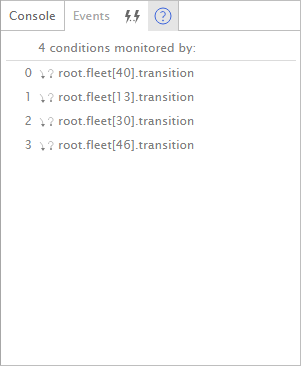 Events panel. Monitored conditions.
For more information on working with Events panel, refer to the Events panel section.
The status bar displays the low-level information about the model execution:
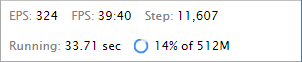
- EPS — Events per second.
- FPS — Frames per second.
- Step — The number of the current model step, that is, the number of discrete events being executed.
- Running — Real time of the simulation. It does not include the time during which the model was paused.
- Memory — Percentage of total JVM memory currently being used by the model.
-
How can we improve this article?
-