

All charts except pie chart can optionally display grid consisting of grid lines and their text labels. You can control the visibility and colors of both as well as labels positions. The text labels can be displayed on the either side of the corresponding chart border (the default positions are below and to the left of the chart).
To alter the chart grid and labels appearance
- Select the chart in the graphical editor or in the
 Projects view.
 - Go to the Appearance section of the Properties view.
- Specify the allocation of horizontal or vertical axis labels relative to the chart using the Axis labels position drop-down list (Below or Above, Left or Right). You can switch labels off by choosing None.
- You can change the labels color. Click the arrow in the Labels color control and choose the color you wish.
- To change the grid color, click the arrow in the Grid color control and choose the color you wish. To switch grid off, choose No Fill.
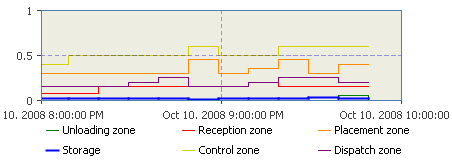
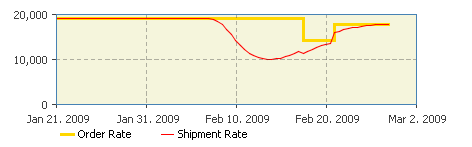
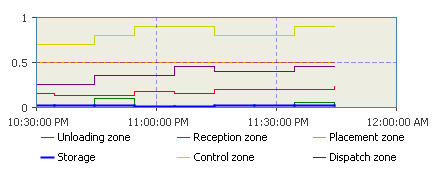
All charts with history (time plot, time stack chart, and time color chart) can display model dates in time (x-) axis labels.
You can choose one of suggested formats or use some custom format which gives the best fit for your needs.
To adjust the format of time axis labels
- Select the chart in the graphical editor or in the Projects view.
- Open the Appearance section of the chart’s Properties.
-
Using the Time axis format drop-down list choose one of suggested formats.
If the Time axis format drop-down list is not visible, probably None is selected in the Horizontal axis labels drop-down list. - If needed, you can display just number of model time units simulated so far in chart labels. In this case you should choose Model time units from the Time axis format drop-down list.
Model date
Model date (date only)
Model date (time only)
-
How can we improve this article?
-