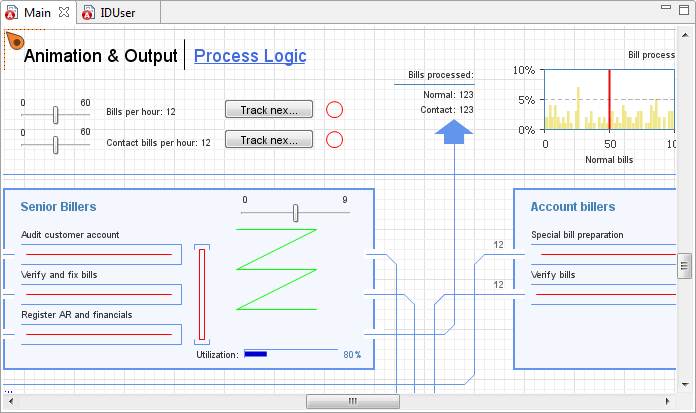
Each agent type has a graphical diagram associated with it. The graphical diagram is the place where you define the structure of your agent type. It plays several roles:
- Defines the interface of the agent.
- Defines a presentation and icon for the agent type using presentation shapes and controls. Graphical editor links shape properties to agent data.
- Defines behavior elements, such as events and statecharts.
- Defines the embedded objects and their interconnection.
To open the graphical editor for an agent type or experiment
-
Double-click the agent type/experiment in the Projects view.
 Graphical editor
-
How can we improve this article?
-

