

AnyLogic supports two ways of moving presentation shapes. First, you can specify shape’s coordinates in pixels in the shape's properties view. And also there is more visual way of moving shapes in the graphical editor using the mouse.
As a rule, when you draw your presentation, it is more convenient to position shapes directly in the editor. While shape properties are commonly used when you need to define how shape should move during the model simulation — the behavior can be easily defined using the corresponding dynamic properties of the shape.
To move a shape graphically
-
Drag the shape using the mouse, or
Select the shape in the graphical editor by clicking on it and move it by pressing the arrow keys on your keyboard.
To define shape coordinates in pixels
- Select the shape in the graphical editor by clicking on it.
- In the Position and size section of the Properties view, enter the shape’s x- and y-coordinates in X and Y edit boxes correspondingly.
When moving presentation shapes, you can use the Ctrl, Alt, and Shift modifier keys to perform additional actions. Modifier keys can work in combination, e.g., Ctrl + Alt + drag creates a copy of the element while allowing to move it with snapping to grid temporarily disabled.
To create a copy of the shape
- Press and hold the Ctrl key (macOS: Cmd key) and drag the shape using the mouse.
To move a shape without snapping it to grid
By default, shapes snap to the graphical editor grid. Use can temporarily disable snapping to grid when moving a shape.
-
Press and hold the Alt key (macOS: Option key) and drag the shape using the mouse, or
Press and hold the Alt key and move the shape by pressing the arrow keys on your keyboard.
To shift a shape horizontally or vertically
- Press and hold the Shift key and drag the shape using the mouse. The shape will only move horizontally or vertically, depending on the dragging direction, thus maintaining vertical or horizontal center alignment.
AnyLogic supports two ways of resizing presentation shapes. First, you can specify shape’s width and height in pixels in the shape’s properties view. And also there is more visual way of rotating shapes directly in the graphical editor.
As a rule, when you draw your presentation, it is more convenient to resize shapes directly in the editor. While shape properties are commonly used when you need to define how shape should change its size during the model simulation — the behavior can be easily defined using the corresponding dynamic properties of the shape.
To resize a shape graphically
- Select the shape in the graphical editor by clicking it.
- You will see handles, that is, several blue rectangles displayed on the shape’s border.
- Click on the handle lying on the shape border you want to move (or the corner of the border, in the case you want to move two borders at once) with the left mouse button and, while holding the left mouse button down, move the mouse in the required resize direction.
- Release the mouse button when finished.
To define shape size in pixels
- Select the shape in the graphical editor by clicking it.
- In the Position and size section of the Properties view, enter the shape’s height and width in Height and Width edit boxes correspondingly.
You can rotate presentation shapes either in the graphical editor or by specifying the required rotation angle in the shape properties.
Presentation shapes can be rotated directly in the graphical editor by dragging the shape’s rotation point.
To show the rotation point of the shape
-
In case of
 rectangle,
  rounded rectangle,
  oval,
oval,  arc,
arc,  text,
text,  image,
  CAD drawing or non-empty group of shapes, select the shape in the graphical editor by clicking it.
In case of polyline or curve, right-click (macOS: Ctrl + click) the shape in the graphical editor and choose Edit shape from the context menu. -
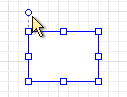
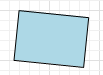
You will see a small circle near or inside the shape (see the figure below). It is the rotation point for the selected shape. If you place the mouse over this point, you will see that the mouse cursor changes to
 .
.
| In order to | Use the mouse like described here | Description |
|---|---|---|
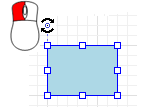
| Rotate the shape by angles restricted by multiples |
Click on the rotation point with the left mouse button and, while holding the button down, move the mouse in the required rotation direction:
|
It is the most frequently used type of rotation. Rotating the mouse right near the rotation point, you restrict the rotation angles to multiples of 15 degrees (15, 30, …).
|
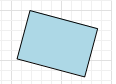
| Rotate the shape by any angle |
Press Alt then click the rotation point and while holding both Alt and the left mouse button down, move the mouse in the required rotation direction:
|
This type of rotation enables to rotate shapes by any angles (not only by integer ones as in the case described above).
|
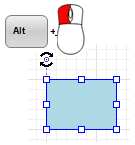
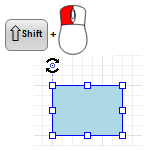
| Rotate the shape by an angle multiple of 90 degrees |
Press Shift, then click the rotation point and while holding both Shift and the left mouse button down, move the mouse in the required rotation direction:
|
The shape gets rotated by angles multiple of 90 degrees (90, 180, 270 degrees).
|
When you rotate a shape, it rotates around its rotation point. For the majority of shapes (rectangle, image, etc.) it is the shape’s top-left corner.
You may need to rotate a shape around its center, which requires shifting the shape’s rotation point. It can be achieved by including the shape in a group: in this case, the group’s origin will be used as a rotation point.
To change the shape’s rotation point
-
Right-click the shape and select Grouping > Create a Group from the context menu.
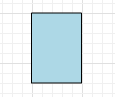
A new group containing the shape will be created. The group’s rotation point is located in the center of the shape, so you can rotate the group and thus the rectangle around its center.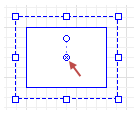
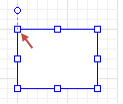
- To further reposition the rotation point, right-click the group and select Select Group Contents from the context menu.
- The group contents, i.e. the rectangle, will be selected. Move the shape so that the rotation point appears in the required position relative to the shape.
To define shape’s rotation angle in degrees
- Select the shape by clicking it in the graphical editor or in the Projects view.
- In the Position and size section of the Properties view, enter the shape’s rotation angle in the Rotation edit box.
To rotate a shape dynamically at the model runtime, specify an expression that will be re-evaluated at the model runtime and return the shape’s rotation angle. This can be done in the Rotation property located in the Position and size section of the shape properties.
If your shape covers some area of the presentation diagram, you may paint it over with any color you wish. The color used to paint a shape over is called shape’s fill color. You may choose any color or even a texture as a fill color of your shape.
To change the shape’s fill color
- Select the shape in the graphical editor by clicking it.
- Open the Appearance section of the shape’s Properties.
- Click the arrow in the Fill color control and choose the color you wish. You can choose No fill value if you do not want the shape to be filled.
- You can change the transparency of the chosen color. To change the shape transparency, click Other Colors... in the opened dialog box. This opens the Colors dialog. Set up the transparency level you like using the Transparency slider. Transparency is defined numerically in the range (0,255): 255 denotes fully opaque color and 0 denotes fully transparent color.
To change the shape’s line color
- Select the shape in the graphical editor by clicking it.
- In the Appearance section of the Properties view, choose the color using the Line color control. Choose No Line, if you do not want the line to be drawn.
To change the shape’s line width
- Select the shape in the graphical editor by clicking it.
- In the Appearance section of the Properties view, choose the line width from the Line width drop-down list, or
Enter the line width value in pixels in the edit box pt. to the right.
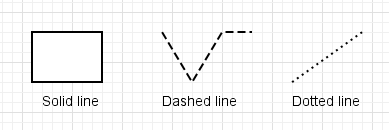
By default, every presentation shape appears with an outline drawn as a solid line.
However, you can make this line dotted or dashed:
To change the shape’s outline style
- Select the shape in the graphical editor or in the Projects view.
- In the Appearance section of the Properties view, choose the required line style from the Line style drop-down list.
You can control visibility of any presentation shape, chart, or control at runtime using its dynamic property Visible.
To define whether a shape (control, chart) should be visible at runtime
- Select the element in the graphical editor, or in the Projects view.
- Go to the shape’s Properties.
- Switch the Visible control to the dynamic mode.
- Type a boolean expression specifying the visibility of the element in the Visible edit box. The shape will be visible when the specified expression evaluates to true, and not visible otherwise. You can call your own boolean function that returns true or false depending on some object’s state at runtime.
Although the 2D presentation is flat, shapes are drawn in a certain order and shown one above the other. This order is called the Z-order because there is a virtual Z axis perpendicular to the surface of the presentation and extending towards the viewer.
There are four common commands that allow you to change the Z-order of a shape:
| Command | Description |
|---|---|
 Bring To Front Bring To Front
|
Places the shape on top of all other shapes. |
 Bring Forward Bring Forward
|
Moves the shape one step up (swaps it with the shape directly in front). |
 Send Backward Send Backward
|
Moves the shape one step down (sends the shape backward one level). |
|
|
Places the shape below all other shapes. |
 Send To Back
To change the Z-order of a shape
- Select the shape in the graphical editor by clicking it.
-
Click the corresponding [Command] toolbar button, or
Right-click (macOS: Ctrl + click) the shape in the graphical editor and choose Order > [Command] from the context menu, or
Choose Draw > Order > [Command] from the main menu.
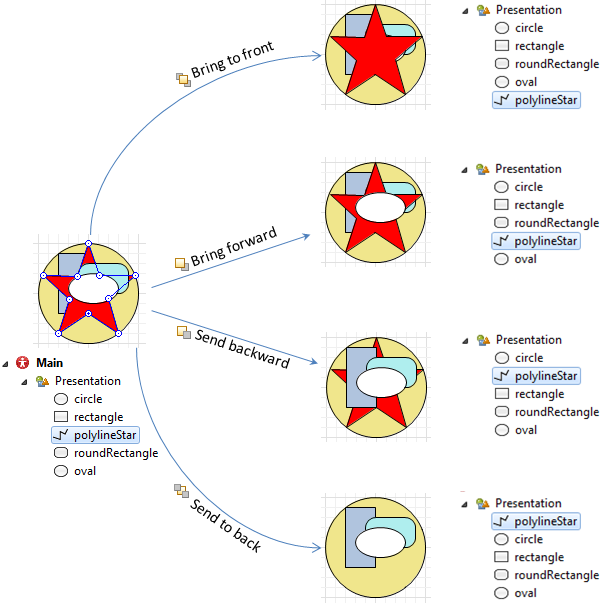
The figure below illustrates these commands. Here we change the Z-order of the red star that is initially placed below two shapes (cyan rounded rectangle and white oval) and on top of two other ones (circle and rectangle). You can see that by changing the Z-order of a shape, you move it in the Presentation tree up or down. The elements of the Presentation tree are actually displayed according to their Z-order — the shape that is placed below all other shapes is the topmost item of the tree, and so on.
Sometimes shapes get hidden below other shapes. You can still select those shapes either by clicking their location several times in the graphical editor or by using the Presentation tree.
To select a shape that is hidden below other shapes in the graphical editor
- Click in the position where the hidden shape is located. The top level shape gets selected.
- Continue clicking in the same position until you select the shape you are looking for. With each click, the next shape in the stacking order will be selected. In the Properties view, you can see which shape is currently selected.
You can change the shape’s Z-order dynamically at model runtime by calling presentation.remove() and presentation.insert() functions.
The insert() function takes two arguments. The first one is the integer index of the new position of the shape in the presentation’s Z-order. The second argument is the shape itself.
In the table below we provide you with the code snippets that change the Z-order of the shape named rectangle.
| Action | Code |
|---|---|
| Bring to front |
|
| Send to back |
|
| Bring forward |
|
| Send backward |
|
You can also play with visibility of the shapes to create the required dynamic presentation.
Sometimes you may need to lock a presentation shape so that it could not be selected in the graphical editor by a mouse click, and model developers would not have a chance to move it, resize, or modify its properties anyhow.
This feature may be useful when you use a background image on the presentation as a base for your animation. If you edit a shape laying over this image, you may accidentally edit the image itself, for example, move it. Sometimes it is hard to click exactly on the border of a shape and you may select the background image instead of the shape you need.
AnyLogic allows users to lock presentation shapes. Locked shapes do not react to mouse clicks — it is impossible to select them in the graphical editor until you unlock them. As for the described example, locking your background image will significantly simplify editing animation as you will not be able to select the layout by inaccurate mouse click.
To lock a shape
- Select the shape in the graphical editor or in the Projects view.
- Select the Lock checkbox in the properties of this shape.
To unlock a shape
- Select the shape in the Projects view.
- Clear the Lock checkbox in properties of this shape.
To unlock all shapes
-
Right-click (macOS: Ctrl + click) the empty space in the graphical editor and choose Locking > Unlock All Shapes from the popup menu.
This will unlock all shapes located on the currently active presentation diagram.
-
How can we improve this article?
-