

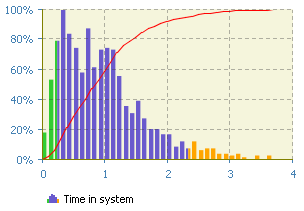
Histogram visualizes statistics collected by a number of Histogram Data objects. The X axis is always scaled to fit all histogram data ranges. The histograms are also scaled along the Y axis so that the highest bar of each histogram occupies the full height of the picture. The PDF bars, the CDF line and the mean location can be shown optionally.
 Histogram
PDF (probability distribution function) is displayed as a number of vertical bars each corresponding to a particular interval with heights proportional to the density (or number) of data samples within the interval. The bars may be setup to look as a solid block or distinct bars.
CDF (cumulative distribution function) is displayed as a polyline on top of PDF, and the mean value — as a vertical line at the corresponding value axis position.
If percentiles are calculated and both low and high confidence measures are specified, the bars corresponding to the lower and higher confidence measures are highlighted with the given colors. The bars that contain the exact “values at risk” (values satisfying the equation CDF(value) = low confidence measure or CDF(value) = 100 - high confidence measure) are drawn in the corresponding intermediate colors.
To create a histogram
- Drag the
 Histogram element from the
  Analysis palette into the graphical editor.
 - Go to the Properties view and set up the histogram properties.
- Add data objects collecting statistical data you want to be displayed on this histogram. Add data objects successively by clicking the
 button in the Data section of the properties and configuring just added object in the property section opened below. Enter the name of histogram data object in the Histogram box and optionally alter some presentation options using the controls below.
 - In the Title box, type the text that will be shown in the chart legend as the title of this data item.
- If you want PDF bars to be shown, select the Show PDF check box and alter PDF color for histogram data objects in the corresponding property sections.
- If you want CDF to be shown, select the Show CDF check box and alter CDF color for histogram data objects in the corresponding property sections.
- If you want mean line to be shown, select the Show mean check box and alter Mean color for histogram data objects in the corresponding property sections.
- If some histogram data objects displayed on this histogram calculate percentiles, you can optionally alter the color of the PDF to the left of low confidence value in the Low % color box and the color of the PDF to the right of high confidence value in the High % color box.
- General
-
Name — The name of the histogram. The name is used to identify and access the histogram from code.
Ignore — If selected, the histogram is excluded from the model.
Visible on upper agent — If selected, the histogram is also visible on the upper agent where this agent lives.
Show PDF — If selected, PDF is shown on the histogram.
Show CDF — If selected, CDF is shown on the histogram.
Show mean — If selected, mean value is shown with a line.
- Data
-
— The button opens a new property section, which allows to configure one more data item you want to visualize on this histogram:
- Title — The title for this data item, which will be shown in the histogram legend.
- Histogram — The name of the Histogram Data object, which will be displayed on this histogram.
- PDF color — [Enabled if Show PDF is selected] Color, which will be used to draw PDF of this histogram data.
- CDF color — [Enabled if Show CDF is selected] Color, which will be used to draw CDF of this histogram data.
- Mean color — [Enabled if Show mean is selected] Color of line, which will visualize the mean value of this histogram data.
- CDF & mean line width — [Enabled if Show CDF or Show mean is selected] Width of CDF and/or mean line.
- Low % color — [Enabled if percentiles are collected for the histogram data] Color, which will be used to draw PDF to the left from low percentile.
- High % color — [Enabled if percentiles are collected for the histogram data] Color, which will be used to draw PDF to the right from high percentile.
To remove a data item from the histogram, click the
 button below the data item’s property section. Use the arrows
  and
and  to arrange the order of the data item sections.
 - Data update
-
Do not update data automatically — If selected, chart is not updated automatically with new data samples.
Update data automatically — If selected, new data samples are added automatically with the specified Recurrence time. Also, you can define here whether you want to Use model time or Use calendar dates. Depending on this choice, you can specify when updating begins with either First update time or Update date properties.
- Appearance
-
Bars relative width — The slider allows adjusting the thickness of the bars (100% — maximum, 50% — half, etc.)
Vertical axis labels — The control specifies the position of vertical axis labels relative to the chart (Left or Right). Choose None, if you do not want labels to be displayed.
Background color — Background color for the chart. Click inside the control and choose a color from the set of most used ones, or choose some custom color using the Colors dialog box.
Border color — Color used to draw chart border.
Labels color — The control specifies the color of the chart labels.
Grid color — The control specifies the color of the chart grid. Choose No fill, if you do not want grid to be displayed.
- Position and size
-
Level — Level where this chart belongs to.
X — The x-coordinate of the histogram’s upper left corner.
Y — The y-coordinate of the histogram’s upper left corner.
Width — The width of the histogram (in pixels).
Height — The height of the histogram (in pixels).
- Legend
-
Show legend — If selected, the chart legend is displayed. You can control the legend position relative to the chart using the Position group of buttons. The size of the area allocated for the legend can be defined using either Width or Height control (depends on the legend’s Position). Text color can also be adjusted.
- Chart area
-
This section defines visual properties of the chart area:
X Offset — The x-offset of the chart area relative to the whole area allocated for the chart and all its accompanying elements.
Y Offset — The y-offset of the chart area relative to the whole area allocated for the chart and all its accompanying elements.
Width — The width of the chart area (in pixels).
Height — The height of the chart area (in pixels).
Background color — Background color for the chart area.
Border color — Color used to draw the border of the chart area.
- Advanced
-
Visible — The chart visibility. The chart is visible when the specified expression evaluates to true, and not visible otherwise.
Replication — The replication factor of the chart. Here you specify how many copies of the chart will be created. If you leave this field empty, only one chart will be created.
On selection change — The code executed when the user selects some particular data item(s). This code is executed either when the user changes the selection by clicking on items in the chart legend, and when the selection is changed programmatically via the function selectItem().
You can use two variables here:
int[] selectedIndices — the indices of currently selected data items.
boolean programmatically — defines, whether items were selected from code (true), or not (false).Show name — If selected, the name of the histogram is displayed on a presentation diagram.
- Data items
-
Function Description void addHistogram (HistogramData hist, String title, Color colorLowPercent, Color colorHighPercent, Color colorPDF, Color colorCDF, float lineWidthCDF, Color colorMean) Adds a histogram data object to the chart with the specified visual appearance.
hist — the histogram data object to add.
title — the histogram data title.
colorLowPercent — the color to draw the PDF bars of the low percentile.
colorHighPercent — the color to draw the PDF bars of the high percentile.
colorPDF — the color to draw the PDF bars.
colorCDF — the color to draw the CDF line.
lineWidthCDF — the CDF line width, 0 for thinnest possible.
colorMean — the color to draw the mean line.int getCount() Returns the number of data items currently displayed by this chart. ChartItem get(int i) Returns the chart’s HistogramData item with the given index. String getTitle(int i) Returns the title of chart’s HistogramData item with the given index. Color getColor(int i) Returns the PDF color of the histogram item with the given index.
i — index of the item.void setColor(int i, Color c) Sets the new PDF color of the histogram item with the given index.
i — index of the item.
c — the new color of the item.void remove(int i) Removes the HistogramData item with the given index from the chart. int remove(ChartItem ci) Removes the given HistogramData item from the chart. void removeAll() Removes all items from the chart. - Selecting data items
-
Function Description void selectItem(int itemIndex, boolean selected) Selects or clears (depending on selected value) chart item with given index. void setSelectedItemIndices(int[] selectedIndices) Selects only chart items with the given indices.
selectedIndices — an array with indices of chart items to be selected (other chart items will be deselected), may be null — this clears selection.int[] getSelectedItemIndices() Returns the number of chart items (data items or data sets) currently displayed by this chart. - Updating chart data manually
-
Function Description void updateData() Updates all data items displayed by this chart. - Location
-
Function Description double getX() Returns the X coordinate of the chart (namely, the X coordinate of its upper left corner). double getY() Returns the Y coordinate of the chart (namely, the Y coordinate of its upper left corner). void setX(double x) Sets the X coordinate of the chart.
x — the new value of X coordinate.void setY(double y) Sets the Y coordinate of the chart.
y — the new value of Y coordinate.void setPos(double x, double y) Sets new coordinates for the chart shape.
x — the new value of x coordinate.
y — the new value of y coordinate. - Size
-
Function Description double getWidth() Returns the width of the chart shape. double getHeight() Returns the height of the chart shape. void setWidth(double w) Sets new width for the chart shape.
w — new value of the chart width.void setHeight(double h) Sets new height for the chart shape.
h — new value of the chart height. - Visibility
-
Function Description boolean isVisible() Checks the visibility of the chart. Returns true if the chart is visible, and false otherwise. void setVisible(boolean v) Sets the visibility of the chart.
v — visibility: if true — the chart is set to be visible, if false — not visible. - Copying chart data to the clipboard
-
Function Description String copyToClipboard() Copies all chart data to the system clipboard in text form. Returns the text representation of all chart data.
-
How can we improve this article?
-