

In the first phase, we will create a simple model simulating a pedestrian flow: how people move inside our building.
Create a new model
- Click the
 New toolbar button. The New Model wizard appears.
 - Specify the name of the new project. In the Model name edit box, type: Subway Entrance Hall.
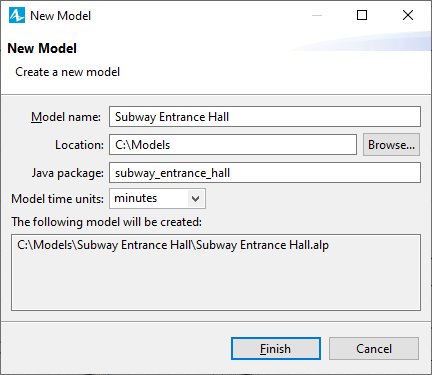
- Specify the location where you want to store your model files. Browse for the existing folder using the Browse button, or type the name of the folder you want to create in the Location edit box.
- Select minutes as the Model time units.
- Click Finish to complete the process.
New model is created. It already has one agent type called
![]() Main and experiment called
Main and experiment called
 Simulation experiment. Agents are the main building blocks of AnyLogic model. In our case the
![]() Main agent will serve as the place where will define all the logic of the model: here we will put the drawing of the entrance hall, and define the flowchart describing the pedestrian flow process.
Main agent will serve as the place where will define all the logic of the model: here we will put the drawing of the entrance hall, and define the flowchart describing the pedestrian flow process.
In the center of the workspace you will see the graphical editor. It shows the diagram of the Main type.
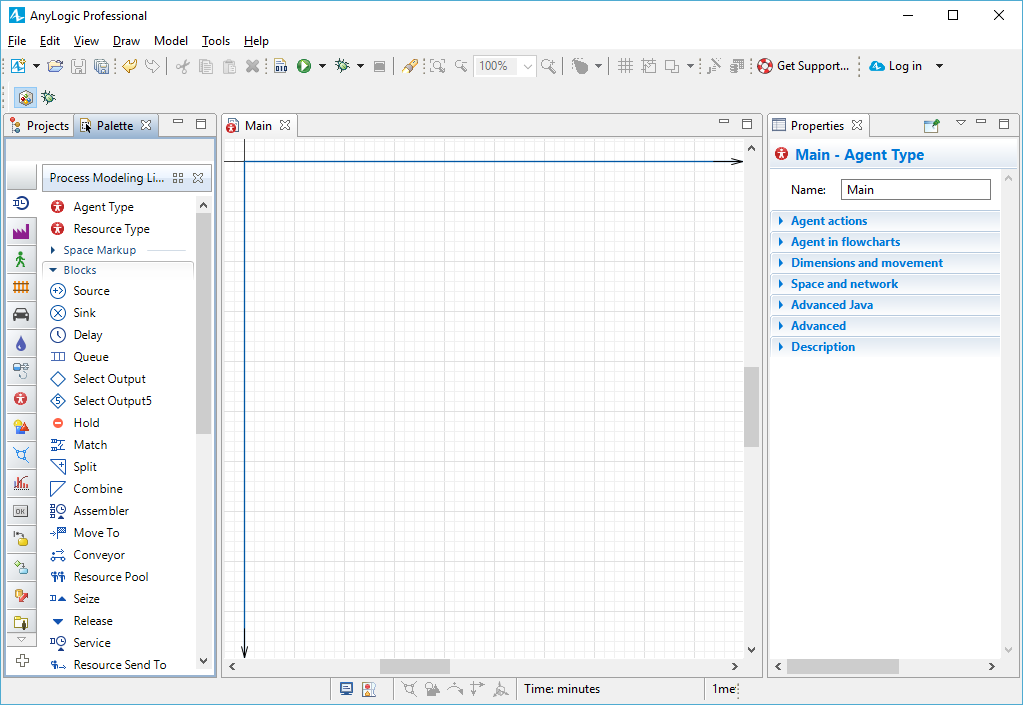
To the left of the graphical editor you can see the
 Projects view and the
 Palette view sharing the same area. The
Projects view provides access to AnyLogic models currently opened in the workspace. The workspace tree provides easy navigation throughout the models. The
Palette view contains all graphical elements you can add onto the graphical editor of your agent just by dragging and dropping. Model elements are grouped by categories in a number of palettes.
Palette view sharing the same area. The
Projects view provides access to AnyLogic models currently opened in the workspace. The workspace tree provides easy navigation throughout the models. The
Palette view contains all graphical elements you can add onto the graphical editor of your agent just by dragging and dropping. Model elements are grouped by categories in a number of palettes.
On the right side of the workspace you can see the
 Properties view. The
Properties view is used to view and modify the properties of a currently selected model element(s). When you select something — e.g., in the
Projects view or in the graphical editor — the
Properties view displays the properties of the selection.
Properties view. The
Properties view is used to view and modify the properties of a currently selected model element(s). When you select something — e.g., in the
Projects view or in the graphical editor — the
Properties view displays the properties of the selection.
When creating a pedestrian dynamics simulation model, you always start with adding a layout image (drawing) of the simulated space (building). Then you draw the walls on top of this image and define the process logic: how the pedestrians move inside this building.
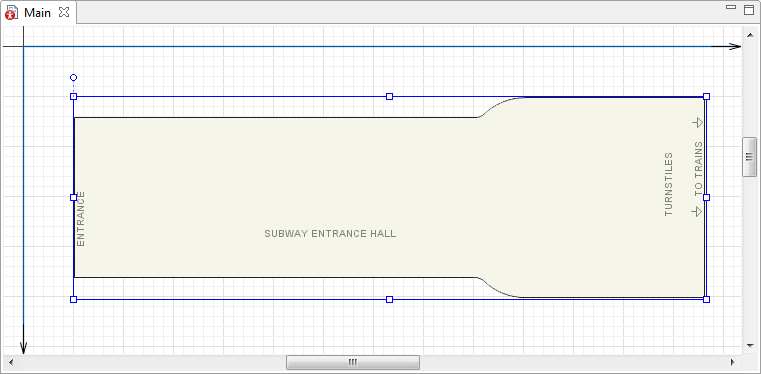
We will use the following layout:
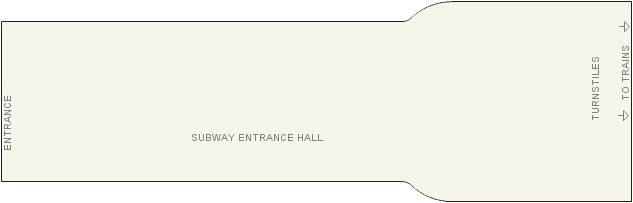
Save the subway entrance hall layout to your computer
- Right-click the image above, click Save image as and select the location for the image file.
Now we can add this image on our model’s canvas.
Add the subway entrance hall layout
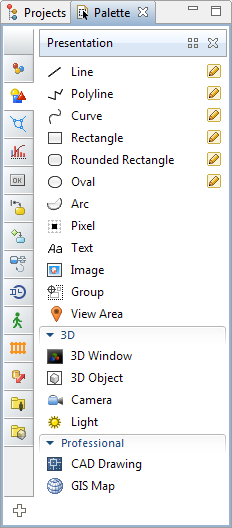
- First, open the
 Presentation palette of the
Palette view. This palette contains shapes you can add on your presentation.
Presentation palette of the
Palette view. This palette contains shapes you can add on your presentation. - To open a palette, just click on the corresponding icon in the vertical ribbon docked to the left part of the palette. While you are not accustomed to the palette icons, you may hover the mouse over the ribbon and wait for the popup window to appear. It will show you the names of all palettes.
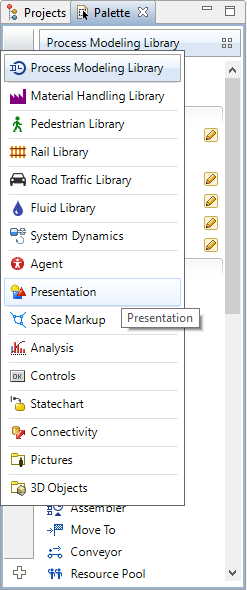
- Select the
Presentation palette to open it:
- Drag the
 Image element from the
Presentation palette on the
Image element from the
Presentation palette on the
 Main graphical diagram.

- Choose the image file to be displayed by this shape. The file browser will open automatically. Browse to the folder where you just saved the layout image file, select it, and then click Open in the dialog box.
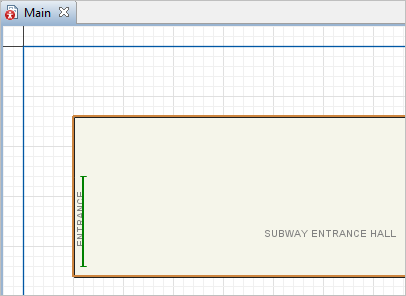
- You will see the drawing displayed in the graphical editor:
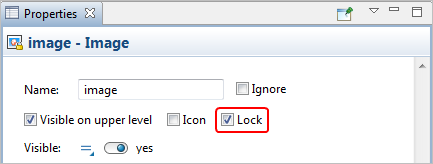
- In the
Properties view, select the Lock checkbox to lock the image. Locked shapes do not react to mouse clicks — it is impossible to select them in the graphical editor until you unlock them. We need this since we will draw other shapes on top of this image and thus want to prevent editing the drawing while drawing shapes over it.
Just a few zones are marked on this drawing. We want to experiment with different layouts and do not know right now where the ticket offices and ticket vending machines area will be located. That is the reason these areas are not marked on the drawing.
Now we will mark up the space of our model. Usually we start with drawing the building walls.
Draw the building walls
- Open the
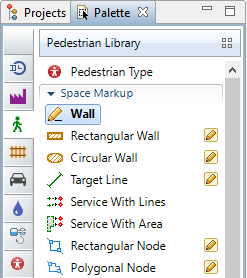
 Pedestrian Library palette to draw the wall like in the figure shown below:
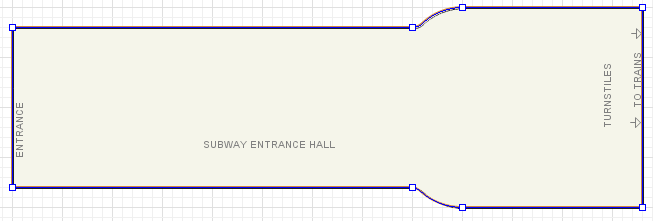
- You draw the wall this way. First, double-click the
 Wall element in the Space Markup section of the
Pedestrian Library palette. The icon of the element should turn into
Wall element in the Space Markup section of the
Pedestrian Library palette. The icon of the element should turn into  . It means that the drawing mode is activated and now you can draw the wall in the graphical editor point by point.
- Subsequently click at the points where you want to place wall corners. Every click appends a linear segment to the wall you are drawing.
- To append a curved segment, press the left mouse button at the point where the curved segment ends and then move the mouse with the button being pressed. While moving you will see how the curving radius changes. To draw the circular segment, move the mouse exactly along the grid line. When done, release the mouse button.

- Finally double-click to place the last point and finish drawing the wall.
If it is hard for you to draw a wall of exactly the same shape, once, you can draw the wall with several Wall shapes.
Now you should define entry and exit points for the pedestrian flow.
Draw an entry line first. Entry is a place where pedestrians appear in the simulated environment. You define the start line for the pedestrian flow with a special markup element
 Target Line.
We want to draw the entry line right where we have the ENTRANCE text on our drawing.
Draw the line where passengers appear
- Drag the
Target Line element from the Space Markup section of the
Pedestrian Library palette onto the graphical editor.
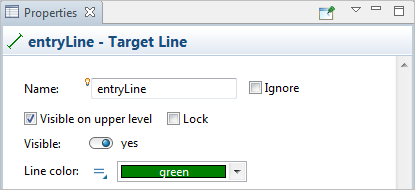
- Resize it and place it exactly as shown in the figure below:
- Name the line entryLine.
Now let’s add one more target line that will define the place where the passengers will move when entering the subway entrance hall.
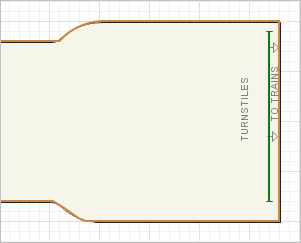
We want them to move to subway trains, so let’s place this target line just over the text TO TRAINS.
Draw the target line
- Draw another target line and place it as shown in the figure below. Entered the subway station, passengers will move here to get to subway trains.
Now we will finish creating the simple model simulating passenger flow. We will define the pedestrian flow process with a flowchart composed from Pedestrian Library blocks.
We will start with a very simple process: passengers enter the subway station (just where we put the  entryLine) and then move to the trains (to our targetLine).
In AnyLogic you create flowcharts by adding the blocks from the library palette to the graphical diagram, setting custom properties for the blocks, and connecting blocks together.
Create the model flowchart
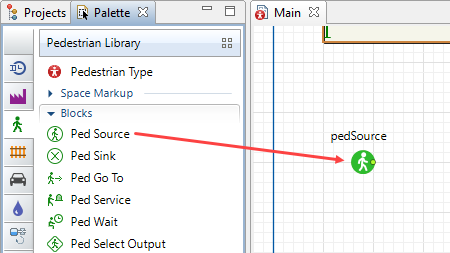
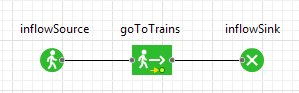
- Add Pedestrian Library blocks on the diagram and connect them as shown in the figure below. To add a flowchart block on the diagram, open the
Pedestrian Library palette, and drag the required block from the palette into the graphical editor.
 While dragging the blocks, and placing them close to each other, you may see the lines connecting the blocks appear. These connectors should connect only the ports lying on right and left borders of the block icons. This is critical, e.g. connecting the pedSink port to the lower port of pedGoTo block will cause an error.
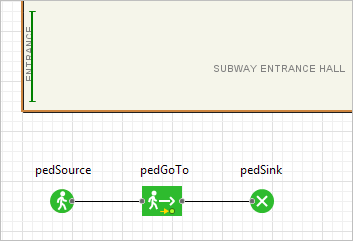
- Rename the blocks. Name them inflowSource, goToTrains, inflowSink. You can do this in the blocks’ properties.
Let’s say a couple of words about these flowchart blocks.
- PedSource block generates pedestrians. It is usually used as a starting point of the pedestrian flow. In our example, it models passenger arrival.
- PedGoTo moves pedestrians from the current location to a new one. We add this block to model how passengers move from the entry to subway trains.
- PedSink block disposes incoming pedestrians. It is usually used as an end point of the pedestrian flow.
Refer to Pedestrian Library Reference Guide for the detailed information about all Pedestrian Library blocks.
Configure the flowchart blocks
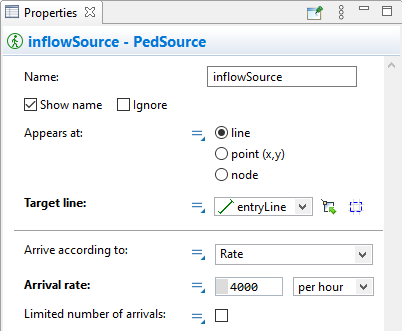
- Select inflowSource block. In the
Properties view, define the place where the passengers will appear. Choose entryLine (the name of our target line drawn earlier at the entrance) from the Target line drop-down list. Another way to choose a markup element in the parameter is to click the selection button
 and select this element in the graphical editor.
 - Set passengers Arrival rate to 4000 per hour.
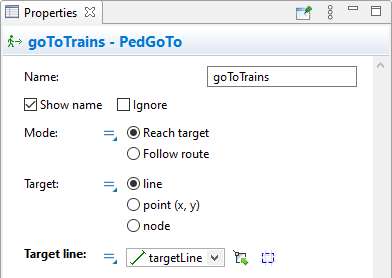
- Now modify the properties of goToTrains. Specify destination for passengers. When entered the building, pedestrians will go to the target you specify here. At this point we assume that all passengers move directly to subway trains. Specify targetLine (the name of the target line we have drawn second) in the Target line field.
- Leave all properties of PedSink block by default.
OK, we’ve finished! Let’s run our model.
Start the model
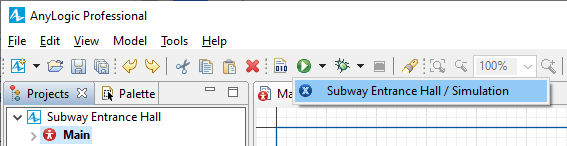
- Click the
 Run toolbar button and choose the experiment you want to run from the drop-down list. Your simulation experiment is called Subway Entrance Hall/Simulation.
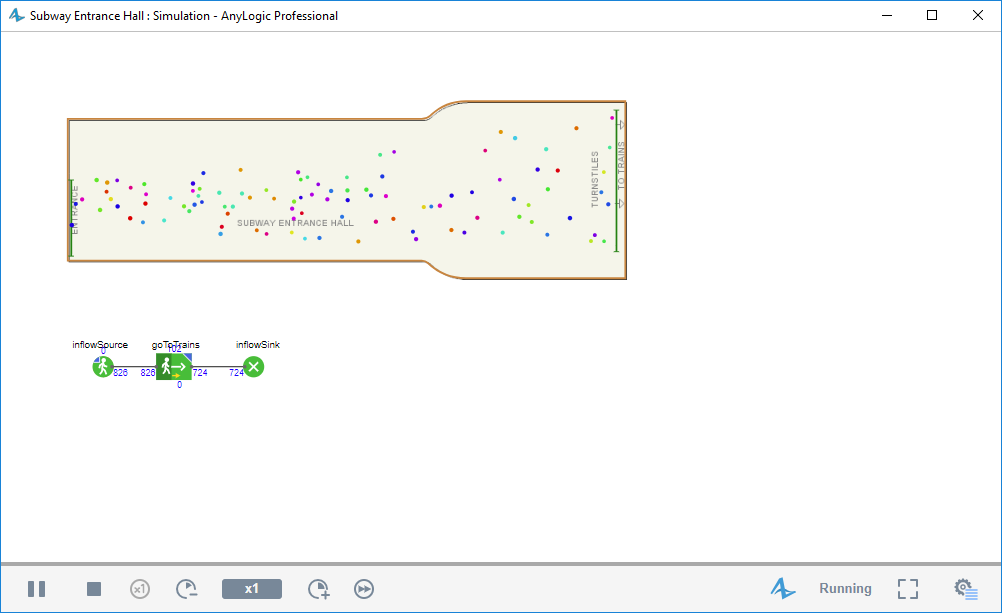
Having started the model, you will see the presentation of your top-level agent,
![]() Main. You can see passengers entering the subway entrance hall and passing through the corridor to the subway trains.
Main. You can see passengers entering the subway entrance hall and passing through the corridor to the subway trains.
OK, great! We have created a simple model in a very short time.
If everything is OK, we can continue further. Follow the link at the very end of this page to open the document describing the next phase of the model development.
-
How can we improve this article?
-