

The GIS Map shape (found on the Space Markup palette) enables you to display and manage GIS (Geographic Information System) maps in a model. The GIS Map shape accommodates two GIS map types:
Tiled map: A map that is downloaded in real time from special online map services, such as OpenStreetMap. Such maps are called "tiled maps" because they are downloaded as tiles, which are small, usually square, images that are placed seamlessly side-by-side to construct the maps.
Shapefile map: A GIS map that is based on data in a set of files that is called a “shapefile” (a shapefile consists of at least three files with the following extensions: SHP, SHX, and DBF). A shapefile contains data about the points, lines, and polygons that make up a GIS map.
With the GIS Map shape you can display layers of both map types, superimposed one over another. On a map you can also add points, routes, and regions.
The GIS Map shape is based on geographic coordinate system and uses the Mercator projection, which is a cylindrical map projection. It distorts the size and shape of large objects, as the scale increases from the Equator to the poles, where it becomes infinite.
If you are connected to the Internet, when you add a GIS Map shape to an agent’s canvas the tiles of a default tiled map start to load automatically so that you can start using a map right away.
To add a GIS map
-
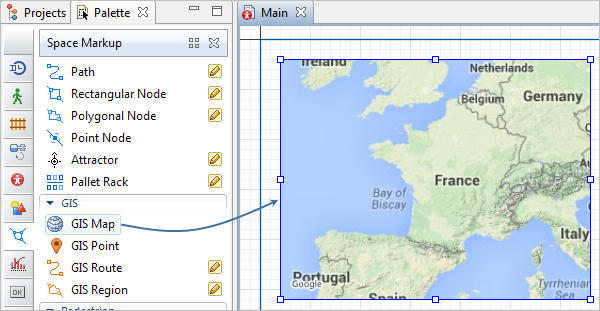
Drag the
 GIS Map element from the GIS section of the
  Space Markup palette into the graphical editor.
- You can then edit the GIS Map shape. For example, it is common to fill the entire model window with the map and to disable run-time panning of this window.
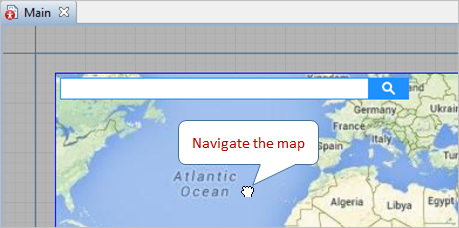
- Next, you might need to edit a map inside the shape. For example, in order to choose the area of the map to be displayed in the model window, you might navigate through the map, pan it, or zoom it.
- Then you can search for locations on the map to add to your model.
- Next, you may add GIS markup elements to a map, by locating them on the map using the GIS Search Results view or by adding them from the Space Markup palette.
- Using GIS markup elements or special code, you can then place the agents on a map.
- Using supported online map services, or an OSM file, you can also add routes to a GIS map.
- General
-
Name — The name of the GIS map shape. The name is used to identify the shape and access it from code.
Ignore — If selected, the GIS map is excluded from the model.
Visible on upper agent — If selected, the shape is also visible on the upper agent where this agent lives.
Lock — If selected, the shape is locked. Locked shapes do not react to mouse clicks — it is impossible to select them in the graphical editor until you unlock them.
Visible — If selected, the shape is visible as part of the agent's presentation at model runtime.
- Routing
-
Routes are — Here you can choose the way the routes in the GIS map are created.
- Requested from OSM server. Select this option and then choose the routing server.
- Loaded from PBF file. Use it to create a routing graph from a file on your hard drive
- Straight lines. Use this to draw the routes as simple straight lines on the GIS map
Routing method — [Not available if the Routes are: Straight lines] Choose here, if you want agents to take Shortest or Fastest routes in the network.
Road type — [Available if Routes are: Requested from OSM server] Choose here the road network type:
- Road
- Rail
- Bike
- Foot
Pathfinding algorithm — [Available if Routes are: loaded from PBF file] Choose the pathfinding algorithm:
- bidirectional A*
- Dijkstra bidirectional
Specify routing graph — [Available if Routes are: loaded from PBF file] Click this button to open the routing graph wizard where you can create a new graph or select to use an existing one. The supported file types are PBF and OSM.
If route not found — [Not available if the Routes are: Straight lines] Here you indicate what you want AnyLogic to do if a route cannot be created (typically because the route does not exist).
- Create straight route — If you want AnyLogic to approximate a route with a straight line and continue running the model.
- Show error dialog — If you want AnyLogic to notify you about such a problem and stop.
- Search
-
Here you choose whether the search of locations at model startup will be performed within the area visible when launching the model (default option) or within the custom user-defined area, the coordinates of which are instantly captured on clicking the Custom search bounds link.
Custom search bounds — Sets the currently visible GIS area as the custom search area. If set, you will be able to launch the model with any other area visible at startup with search performed within the custom area. If the specified agent location(s) cannot be found within the custom search bounds, the closest location(s) with the same name(s) outside this area will be chosen. The coordinates of the custom search area are available if the Custom search bounds option is enabled. These coordinates define the position of the two points (placed in the intersection of the latitude and longitude values): in the bottom left and the top right corners of the area:
- Bottom (lat, deg) — The latitude of the bottom left point, measured in degrees.
- Left (lon, deg) — The longitude of the bottom left point, measured in degrees.
- Top (lat, deg) — The latitude of the top right point, measured in degrees.
- Right (lon, deg) — The longitude of the top right point, measured in degrees.
Don't use custom search bounds — [Visible if the Custom search bounds option is enabled] Removes the coordinates of the custom defined area. Search will be performed within the GIS area visible when launching the model.
- Shapefiles
-
Here you specify shapefile(s) to be shown by this GIS map. To add a shapefile, use the
 button. You will see a dialog box prompting you to choose a shapefile. Having selected the file, you will see the GIS map displaying the data from the selected shapefile. The file will also automatically appear in the model's Resource folder in the Projects view. This way you will be able to track the current state of this file, switch between the absolute and relative file paths, etc.
In the Shapefiles properties section, you will see a set of properties of this shapefile:
Visible — Using this checkbox, you can show / hide the shapefile data on the GIS map.
Shapefile, Dbf — read-only fields displaying the shapefile names.
Name column index — Here you specify the name of the shapefile's column that contains the shapefile element names. It is very important to find out the name of this column in the shapefile and specify it here if you want to convert your GIS shapefile to rail network, or to road space markup shapes. In this case space markup elements created on the conversion will have meaningful names (and will not be randomly named like road145, road146).
Default line color, Default fill color — You can customize the shapefile's line color and fill color.
To remove a shapefile, select its section, then click the
 button.
 - Center and scale
-
You can also pan and zoom the map using map edit mode.
Latitude, deg — The latitude of the map's center, measured in degrees (-90 ... )
Longitude, deg — The longitude of the map's center, measured in degrees (-180 ... )
Scale 1: — Scale of the map projection, 1:<specified value>, e.g. 1:10000.
- Appearance
-
Border color — Color of the shape's border.
Fill color — Fill color of the GIS map. You will not see this color if the option Show tiles is selected.
- Position and size
-
X — X-coordinate of the upper left corner of the GIS map shape.
Y — Y-coordinate of the upper left corner of the GIS map shape.
Width — The width of the GIS map shape, in pixels.
Height — The height of the GIS map shape, in pixels.
- Advanced
-
On click — Here you can type Java code that will be called each time a user clicks on the shape at the model runtime. By default the code returns false. If there are several shapes overlapping in the click point, AnyLogic iterates through these shapes in their Z-order, from top to bottom and sequentially executes shape's On click actions. Iteration stops when action code returns true.
Show tiles — The option Show tiles is selected by default, so that you can use a GIS map as soon as you add the GIS map shape to the agent’s diagram. Deselect it if you do not want the tile layer to be visible.
Local variables:
- self — the element itself
- clickx — x-coordinate of the click relative to the shape coordinates
- clicky — y-coordinate of the click relative to the shape coordinates
Use custom tile URL — If you want to use a custom online tile map service, select this option and provide the URL of the service in the text field below. The URL for the tiles should look like https://tile.openstreetmap.org/{zoom}/{x}/{y}.png. It handles requesting the tile with the appropriate x and y coordinates and zoom level from the tile server, for example: https://tile.openstreetmap.org/9/150/192.png. For details on the URL scheme, see the OpenStreetMap wiki page.
If a custom tile provider is used, selecting tile providers manually from the Tile provider list is disabled. For details on the custom tile URL scheme, see the OpenStreetMap wiki page.Use custom route provider — If you want to use a custom online route service, click here and the edit box labeled Custom route provider will appear. In this box, AnyLogic has provided sample code with comments.
Routes and regions generalization uses — Here you can define the generalization (that is, the degree of simplification) for routes and regions when you run the model, i.e. how many points they should contain when displayed. Depending on your needs, choose either Current map scale or define the Absolute precision in meters.
To enter and exit the map edit mode
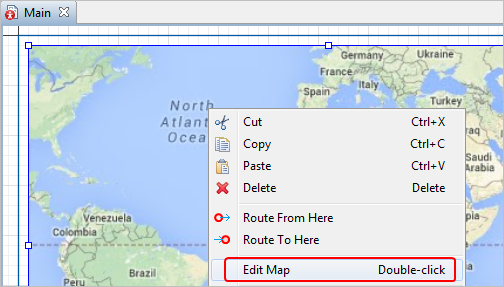
- Double-click a map to enter its edit mode, or right-click a map and select Edit map from the context menu. The rest of the graphical editor will then be grayed out.
-
To choose the area of the map you want to use for the model, pan the map or zoom in and out.
- To exit the edit mode click the grayed out area of the graphical editor, or double-click the map. Alternatively, right-click the map and select Finish Map Editing from the menu.
You can edit the properties of a multiple selection of markup elements, for example, change their appearance or lock their positions on the map.
To select several elements on the map
- Hold down the Ctrl key and click the markup elements on the map one by one to select or deselect elements.
- Also, in order to select several elements while editing the map, you can hold down the Ctrl or Shift key and drag the selection rectangle around the elements.
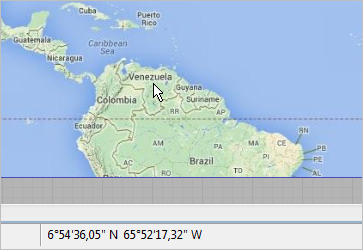
When you are in the map edit mode, the AnyLogic status bar displays the latitude and longitude coordinates of the current mouse cursor position:
If you do not want to use a tiled map, or do not have Internet access, you can add a shapefile map from a shapefile. In this case you need to add a file manually to the shapefile table in the Shape files section.
To load a GIS map from a shape file
- Go to the Shapefiles section of the map's Properties view.
- Add a shapefile (with the SHP file extension) by clicking the button. This opens the Open dialog box.
- Browse to the file you want to add, then select it and click Open. The files for the shapefile will be copied to the model folder. The files will also automatically appear in the model's Resource folder in the Projects view. This way you will be able to track the current state of these files, switch between the absolute and relative file paths, etc.
Using functions, you can access and manipulate many map characteristics.
- Map center
-
Function Description void setCenterLatitude(double centerLatitude) Sets the latitude of the map projection center.
centerLatitude — new latitude of the map projection center, measured in degrees: (-90 ... (South) ... 0 ... (North) ... 90).void setCenterLongitude(double centerLongitude) Sets the longitude of the map projection center.
centerLongitude — new longitude of the map projection center, measured in degrees: (-180 ... (West) ... 0 ... (East) ... 180).void setProjectionCenter(double centerLatitude, double centerLongitude) Sets the center of the map projection.
centerLatitude — new latitude of the map projection center, measured in degrees: (-90 ... (South) ... 0 ... (North) ... 90).
centerLongitude — new longitude of the map projection center, measured in degrees: (-180 ... (West) ... 0 ... (East) ... 180.void pan(int toEast, int toNorth) Moves the map projection center. Parameters are amounts of delta in the resulting offset. One horizontal delta is a half of longitude difference from map projection center to the west/east bound of projection. One vertical delta is a half of latitude difference from map projection center to the south/north bound of projection.
toEast — number of horizontal deltas to be added to the projection center, if positive, center is moved to the East, if negative — to the West.
toNorth — number of vertical deltas to be added to the projection center, if positive, center is moved to the North, if negative — to the South. - Map scale
-
Function Description void setMapScale(double mapScale) Sets the scale of map projection.
mapScale — the scale (ratio between meters on the screen and meters on the Earth surface), e.g. 1/100000 means “1 km in 1 cm”.void zoomIn() Increases the scale of the map projection by a factor of 2. void zoomOut() Decreases the scale of the map projection by a factor of 2. void fitBounds(double bottomLat, double leftLon, double topLat, double rightLon) Makes map fit the specified bounds.
bottomLat — the latitude of the bottom bound of the visible area, measured in degrees: (-90 ... (South) ... 0 ... (North) ... +90)
leftLon — the longitude of the left bound of the visible area, measured in degrees: (-180 ... (West) ... 0 ... (East) ... 180)
topLat — the latitude of the top bound of the visible area, measured in degrees: (-90 ... (South) ... 0 ... (North) ... 90)
rightLon — the longitude of the right bound of the visible area, measured in degrees: (-180 ... (West) ... 0 ... (East) ... 180) - Distances
-
Function Description double getDistance(double latFrom, double lonFrom, double latTo, double lonTo) Returns distance between 2 given points (in meters).
latFrom — the latitude of the 1st point, measured in degrees: (-90 ... (South) ... 0 ... (North) ... 90).
lonFrom — the longitude of the 1st point, measured in degrees: (-180 ... (West) ... 0 ... (East) ... 180).
latTo — the latitude of the 2nd point, measured in degrees: (-90 ... (South) ... 0 ... (North) ... 90).
lonTo — the longitude of the 2nd point, measured in degrees: (-180 ... (West) ... 0 ... (East) ... 180).double getDistance(GISPoint fromPoint, GISPoint toPoint) Returns distance between 2 given points (in meters).
fromPoint — the 1st point.
toPoint — the 2nd point.double getDistanceByRoute(double latFrom, double lonFrom, double latTo, double lonTo) Calculates length of route (in meters) from one point to another. Uses the route provider to create a route.
latFrom — the latitude of the 1st point, measured in degrees: (-90 ... (South) ... 0 ... (North) ... 90)
lonFrom — the longitude of the 1st point, measured in degrees: (-180 ... (West) ... 0 ... (East) ... 180)
latTo — the latitude of the 2nd point, measured in degrees: (-90 ... (South) ... 0 ... (North) ... 90)
lonTo — the longitude of the 2nd point, measured in degrees: (-180 ... (West) ... 0 ... (East) ... 180)double getDistanceByRoute(GISPoint fromPoint, GISPoint toPoint) Calculates length of route (in meters) from one point to another. Uses the route provider to create a route.
fromPoint — the first point
toPoint — the second point - Meters to length units ratio
-
Function Description double fromLengthUnits(double length, LengthUnits units) Converts the given length value from specified units to meters. Returns the length measured in meters.
length — value of length
units — a constant defining the length unitsdouble toLengthUnits(double length, LengthUnits units) Converts the given length value from meters to specified units. Returns the length measured in the given length units.
length — value of length
units — a constant defining the length units - Mouse navigation
-
Function Description boolean isMouseNavigationEnabled() Returns true if panning and zooming with a mouse are allowed, false otherwise. void setMouseNavigationEnabled(boolean mouseNavigationEnabled) Manages the ability to pan and zoom the map with a mouse.
mouseNavigationEnabled — visibility: if true — the mouse panning and zooming is allowed, if false — forbidden - Routes
-
Function Description GISRoute getRoute(GISPoint start, GISPoint end) Creates a unidirectional route from one GIS point to another, allowing travel in only one direction.
start — A GIS Point that will be the start of the route.
end — A GIS Point that will be the end of the route.GISRoute getRoute(GISPoint start, GISPoint end, boolean bidirectional) Creates a route between the specified GIS Points.
start — A GIS Point that will be the start of the route.
end — A GIS Point that will be the end of the route.
bidirectional — if true, the newly created GIS route will be bidirectional. If false, a one-way route will be created.GISRoute getRoute(double startLatitude, double startLongitude, double endLatitude, double endLongitude) Creates a unidirectional route from one GIS point to another, allowing travel in only one direction.
startLatitude — A latitude of the route’s starting point.
startLongitude — A longitude of the route’s starting point.
endLatitude — A latitude of the route’s ending point.
endLongitude — A longitude of the route’s ending point.GISRoute getRoute(double startLatitude, double startLongitude, double endLatitude, double endLongitude, boolean bidirectional) Creates a route between the specified points on a GIS map.
startLatitude — A latitude of the route’s starting point.
startLongitude — A longitude of the route’s starting point.
endLatitude — A latitude of the route’s ending point.
endLongitude — A longitude of the route’s ending point.
bidirectional — if true, the newly created GIS route will be bidirectional. If false, a one-way route will be created.IGISRouteProvider getRouteProvider() Returns the default route provider for all agents in GIS space. Check out the API documentation on the GISRoute object to learn about other ways of creating a GIS route programmatically. - Working with layers
-
Function Description ShapeGISMap.Layer[] getLayers() Returns the array of layers used in this GIS Map. The array shouldn’t be modified structurally: only items can be accessed for modification. boolean isLayerVisible(String shapeFileName) Tests if a shapefile layer is visible. Returns true if the layer is visible, false if not visible or not found.
shapeFileName — the name of the shapefile.void setLayerVisibility(String shapeFileName, boolean visible) Sets the visibility of the shapefile layer.
shapeFileName — the name of the shapefile.
visible — visibility: if true — the layer is set to be visible, if false — not visible - Adding/removing regions
-
Function Description void add(GISMultiRegion markupElement) Adds GIS region to the drawing set of elements.
markupElement — GIS Region that will be added onto the GIS map.void add(GISMarkupElement markupElement) Adds GIS markup element to the drawing set of elements.
markupElement — GIS markup element that will be added onto the GIS map.void remove(GISMultiRegion markupElement) Removes GIS region from the drawing set of elements.
markupElement — GIS Region that will be removed from the GIS map.void remove(GISMarkupElement markupElement) Removes a GIS markup element from the drawing set of elements.
markupElement — GIS markup element that will be removed from the GIS map. - Search
-
Function Description List<GISPoint> search(String query) Searches for all points on the Earth corresponding to the user’s query.
query — the queryList<GISNode> search(String query, boolean area, boolean visibleAreaOnly) Searches for all GIS nodes corresponding to the user’s query.
query — the query
area — if true — GIS regions will be searched, if false — GIS points
visibleAreaOnly — if false, the search is performed across the whole Earth, if true, the logic is more nuanced. First, the search is performed within the ”visible area”. The visible area is defined at design time, before launch. It is either explicitly locked to a specific region at design time, or (otherwise) equal to the portion of the map that was visible at design time when the model was launched (i.e., when the code was generated). If nothing is found within this ”visible area”, the search is retried across the whole Earth.List<GISRegion> searchRegion(String query) Searches for all regions corresponding to the user’s query.
query — the queryList<GISMultiRegion> searchMultiRegion(String query) Searches for all multiregions corresponding to the user’s query.
query — the queryGISPoint searchFirst(String query) Searches for a point on the Earth corresponding to the user’s query.
query — the queryGISRegion searchFirstRegion(String query) Searches for a region corresponding to the user’s query.
query — the queryGISMultiRegion searchFirstMultiRegion(String query) Searches for a multiregion corresponding to the user’s query.
query — the queryvoid fitBounds(double bottomLat, double leftLon, double topLat, double rightLon) Makes map fit the specified bounds.
bottomLat — the latitude of the bottom bound of the visible area, measured in degrees: (-90 ... (South) ... 0 ... (North) ... +90)
leftLon — the longitude of the left bound of the visible area, measured in degrees: (-180 ... (West) ... 0 ... (East) ... 180)
topLat — the latitude of the top bound of the visible area, measured in degrees: (-90 ... (South) ... 0 ... (North) ... 90)
rightLon — the longitude of the right bound of the visible area, measured in degrees: (-180 ... (West) ... 0 ... (East) ... 180) - Shape position
-
Function Description double getX() Returns the X coordinate of the shape (namely, the X coordinate of its upper left corner). double getY() Returns the Y coordinate of the shape (namely, the Y coordinate of its upper left corner). void setX(double x) Sets the X coordinate of the shape.
x — the new value of X coordinate.void setY(double y) Sets the Y coordinate of the shape.
y — the new value of Y coordinate.void setPos(double x, double y) Sets new coordinates for the shape.
x — the new value of X coordinate.
y — the new value of Y coordinate. - Shape size
-
Function Description double getWidth() Returns the width of the shape, in pixels. double getHeight() Returns the height of the shape, in pixels. void setWidth(double width) Sets the width of the shape.
width — the new value of width, in pixelsvoid setHeight(double height) Sets the height of the shape.
height — the new value of height, in pixelsdouble getScaleX() Returns the scale of the shape along X axis. double getScaleY() Returns the scale of the shape along Y axis. void setScaleX(double sx) Sets the scale of the shape along X axis.
sx — the new value of scale along X axis, 1 = keep original size.void setScaleY(double sy) Sets the scale of the shape along Y axis.
sy — the new value of scale along Y axis, 1 = keep original size.void setScale(double sx, double sy) Sets the scales of the shape along both axes.
sx — the new value of scale along X axis, 1 = keep original size.
sy — the new value of scale along Y axis, 1 = keep original size.void setScale(double s) Sets the same scale of the shape along both axes.
s — the new value of scale along both axis, 1 = keep original size - Shape visibility
-
Function Description boolean isVisible() Checks the visibility of the shape. If the shape is visible, returns true, otherwise returns false. void setVisible(boolean v) Sets the visibility of the shape.
v — visibility: if true — the shape is set to be visible, if false — not visible.
You can navigate (i.e. pan or zoom) a GIS map both at model design time and at model runtime.
At design time, by entering the map edit mode you can select the part of a map, as well as the level of the map’s detail, that you want to be displayed at runtime.
To enter and exit the map edit mode
- To enter the map edit mode, either double-click the map or right-click it and select Edit Map from the menu:
- The rest of the graphical editor will become grayed out. You can now pan or zoom the map.
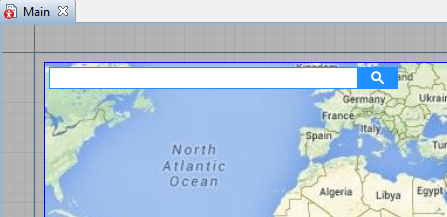
- To exit the map edit mode, either click the grayed-out area of the graphical editor or double-click the map. Alternatively, right-click the map and select Finish Map Editing from the menu.
To pan the map
- Enter the edit mode for the map.
- Click on the map with the left mouse button and move the mouse while holding the button down. While panning a map, you will see a hand cursor:
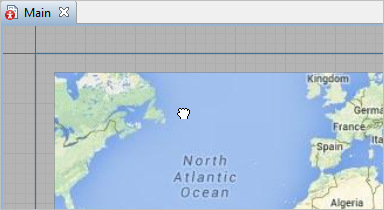
- If you hold down the right mouse button and move it, you will pan the entire graphical editor with the GIS map still in edit mode.
- When finished panning, exit the map edit mode.
To zoom in or out
- Double-click the map to enter its edit mode. The rest of the graphical editor will become grayed out.
- To zoom in, move the mouse wheel away from you; to zoom out, move the mouse wheel toward you. The map will zoom in or out at the mouse cursor location. To zoom in or out at a different location, first pan the map. If you are not in the map edit mode, moving the mouse wheel will scroll the entire canvas.
- If you hold down the Ctrl button and move the mouse wheel, the map will zoom with smaller steps. Although it may be slower to zoom this way, you can achieve greater precision.
- When finished zooming, exit the map edit mode.
At runtime you can pan the GIS map the same way as at design time: hold down the left mouse button and move the mouse.
Some users may confuse panning inside the map and panning of the model window with the right mouse button. You can disable panning of the model window, so that users do not accidentally pan it at runtime.
To disable panning of the model window at runtime
- Select the
 Simulation experiment in the model tree to open its Properties view.
 - Go to the Window section and clear the Enable zoom and panning check box.
- Panning of the model window with the right mouse button is now disabled. But panning the map itself with the left mouse button is still enabled.
Zooming in and out during runtime is just as easy as at design time.
To zoom in or out
- Put the mouse cursor over the map location that you want to see closer when zooming in.
- To zoom in, move the mouse wheel away from you. The GIS map will zoom in to the location around the mouse cursor location. This location will become the map’s center, so that you can better see the location itself and its surrounding area.
- To zoom out, move the mouse wheel toward you. The map will zoom out relative to its center. It does not matter where the mouse cursor is located. To zoom out another part of the map, you can pan the map.
If you hold down the Ctrl key and move the mouse wheel, you will zoom the model window itself rather than the map.
Using functions, you can change a map's zoom, pan, or center coordinates dynamically during model runtime.
AnyLogic provides a GIS map tile layer, which is a part of a GIS map that contains a tiled map. A tiled map is a map that is downloaded in real time from special online map services, such as OpenStreetMap. Such maps are called "tiled maps" because they are downloaded as tiles, which are small, usually square, images that are placed seamlessly side-by-side to construct the maps. You can choose an online tiled map service in the Properties section of a GIS Map shape.
When you navigate a tiled map at design time, all the tiles you display are saved in a special subfolder of the model folder called cache. With a cache, you do not have to continually make online requests when working with a section of a map. This makes you less dependent on an Internet connection and increases the model’s performance. It also allows you to easily share the model and to run it without an Internet connection.
If the online service does not meet your needs, you can add a map from the shapefiles on your computer, or define a custom tile provider.
To enable custom tile provider
- Select the GIS map shape in the graphical editor and go to its Properties view.
- Open the Advanced section and select the Use custom tile URL check box.
- In the text field that appears, provide the tile map service URL. The URL for the tiles should look like https://tile.openstreetmap.org/{zoom}/{x}/{y}.png. It handles requesting the tile with the appropriate x and y coordinates and zoom level from the tile server, for example: https://tile.openstreetmap.org/9/150/192.png. For details on the URL scheme, see the OpenStreetMap wiki page.
Because a map is smaller than the objects it represents, for a map to be readable its elements must be generalized (that is, simplified). Although the AnyLogic GIS map tile layer has such generalization built in, for some elements that you add to a map, such as routes or regions, you may need to manually configure their generalization settings.
Depending on the generalization settings and how many points are used to display an object, GIS routes and the borders of GIS regions may appear quite rough and jagged. Although increasing the number of points to display will bring an object closer to its real scale and make it appear smoother, this can also degrade the model’s performance.
Just like it is not possible to display all the streets in every city when a map displays a country, at smaller map scales just fewer points of GIS routes and GIS region borders are displayed. If you zoom in on a map you will see that as more points are displayed a route or region becomes more detailed and less generalized. At design time, the generalization of routes and regions works the same way as the tile layer generalization.
Below you can see two figures displaying the same route with two different generalization settings. The first figure displays greater detail, but will decrease the model’s performance; moreover, agents following this route will rotate too often and make the animation look odd. The second figure provides a more acceptable level of detail.
Agent's travel time along a route does not depend on the generalization; rather, it depends only on the actual route length. Therefore, route generalization does not degrade accuracy in travel time. Generalization affects only the model’s animation and its performance.
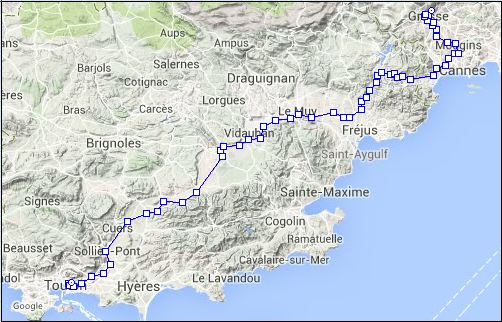 Grasse-Toulon route created with generalization up to 100 meters
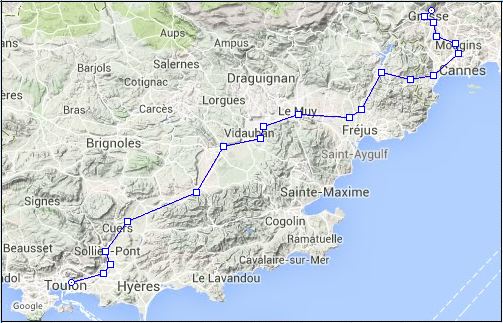 The same route created with generalization up to 1000 meters
To select the generalization type
- Select the GIS map shape in the graphical editor and go to its Properties view.
- Expand the Advanced section. There you will find the parameter called Routes and regions generalization uses.
- You can choose one of the two modes: Current map scale or Absolute precision (meters).
- In case you leave Current map scale selected, the precision of routes and regions on the map will be defined by the current scale of the map. At the greater map scale, its routes and regions will be more detailed (i.e. they will contain more points). Vice versa, for the smaller map scale, the rendering of routes and regions will be less precise.
- If you choose the Absolute precision (meters) option as the generalization rule, then routes and regions will be rendered with the precision you enter in the edit box next to this option. The default precision is 1000 meters.
-
How can we improve this article?
-