

System Dynamics element. Flow (also known as rate) as well as stock is a fundamental element of stock and flow diagram.
While stocks define static part of the system, flows define rate of change for the stocks — how values of stocks change in time and thus define the dynamics of the system.
You can find more information on stocks and flows in Wikipedia: Stock and flow.
Here are some examples of stocks and flows:
| Stock | Inflows | Outflows |
|---|---|---|
| bank balance | deposits interest |
withdrawals |
| housing stock | housing investment | housing depreciation |
| CO2 in atmosphere | tons emitted | tons sequestered |
| population | births immigration |
deaths emigration |
| fuel tank | refueling | fuel consumption |
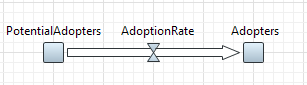
Flow may flow out of one stock and flow in another. Such a flow is outflow for the first stock and inflow for the second one at the same time, see the figure below:
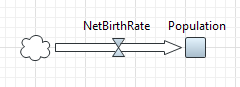
Flow may flow into a stock from nowhere. In this case the cloud (denoting "source") is drawn at the starting point of the flow.
And, symmetrically, flow may flow out from a stock to "nowhere". In this case the cloud (denoting "sink") is drawn at the end point of the flow.
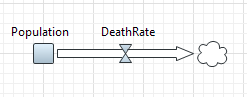
The arrow shows the direction of the flow.
To create a flow from one stock to another
- Double-click the
 Flow element in the
  System Dynamics palette. The icon of the element should turn into
  . It means that the drawing mode is activated and now you can draw a flow in the graphical editor point by point.
 - Start drawing the flow in the graphical editor. Click the stock where the flow flows out (or just somewhere in the diagram, in case the flow originates outside the model bounds).
- If you want to draw a flow not with a straight line, but with a shape of some custom form, subsequently click at other points where you want to place other salient points.
- Finally click the stock where the flow flows in (or double-click on the diagram, in case the flow flows to nowhere).
- Go to the Properties view to set up properties of the flow.
- Specify the name of the flow in the Name edit box.
In case your stocks have Classic equation style, their formulas will be updated automatically. In case stocks have Custom equations, you will need to perform refactoring (When finished typing, press Ctrl + Enter to rename flow names that are also mentioned in formulas of stocks.)
- Type the formula calculating the value of the flow in the flow_name = edit box. (you may use code completion here to insert names of other elements).
In case there are some other elements mentioned in the formula, you should draw links from those elements to this flow first. There is, however, link autocreation mechanism supported by AnyLogic — you may just specify the formula — when finished typing, the error indicator will be shown to the left of the formula. Click this indicator to show the pop-up menu with items offering you to create missing links from the mentioned elements to this flow. Choosing some item from the list you create the corresponding missing link. You can easily create all missing links in such a way.
- If you do not want this flow to get its value according constantly re-evaluated formula but otherwise want it to be equal to some specified value (that can be changed during the simulation), check the Constant check box.
Constant flow is drawn with an equal sign over its icon:
 .
. - If you explicitly specify units of measurements for elements of your stock and flow diagram, do it for this flow. Go to the Advanced section of its properties and select the System dynamics units checkbox and type the unit name in the edit box (you can find more information on units and unit checking in Units).
- General properties
Name — The name of the flow. The name is used to identify and access the flow in formulas.
Show name — If selected, the name of the flow is displayed on the presentation diagram.
Ignore — If selected, the flow is excluded from the model.
Visible on upper agent — If selected, the variable is also visible on the upper agent where this agent lives. This may be needed if you are creating hierarchical system dynamics models by exposing system dynamics variables onto interface of the agent type and connecting interface variables of agents.
Show at runtime — If selected, the flow is visible on the presentation at runtime.
Color — The fill color of the flow icon and arrow.
Array — If selected, the flow is of array type. Properties for array variables look slightly different. Instead of one <flow_name>= field defining the formula for the flow, there can be several fields defining formulas for some particular elements or sub-arrays of the array variable. To add new section allowing to define one more formula, click the Add formula button. Defining formulas for array elements and sub-arrays is described in Defining equations for array variables.
Dependent — If selected, the flow will get value of the connected variable constantly.
Constant — If selected, the flow is a constant, i.e. its value does not change according constantly re-evaluated formula but is equal to the specified value (that can be changed by user during the simulation).
flow_name = — The formula defining the value of the flow. In the case this flow is of array type, there can be several fields defining formulas for some particular elements or sub-arrays of the array variable. To add new section allowing to define one more formula, click the Add formula button. Defining formulas for array elements and sub-arrays is described in Defining equations for array variables.
- Array properties
Array properties are available only if this flow is of array type. To make the flow an array, check the Array check box in the General properties section.
Available dimensions — The list of dimensions defined in this model.
Selected dimensions — The list of dimensions that will act as dimensions of this array variable.
These properties are used to define dimensions that make up the array variable. Refer to the Defining an array variable section for details.- Advanced
System dynamics units — If selected, you will be able to specify units of measurements for this variable in the edit box to the right. Having specified units for all elements of your stock-and-flow diagram, you may perform unit checking to find out dimension inconsistencies in your model.
At model runtime you can view flow value and chart as well as copy the collected history of values to Clipboard, you can find more information in Viewing values and charts at runtime.
You can customize the flow appearance, namely you can change its color and change the form of the flow by adding some intermediate salient points.
To change the flow color
- Select the flow by clicking it in the graphical editor or in the Projects view.
- Go to the Properties view and choose the required color from the Color control.
To add the salient point
- Double-click the flow arrow in the graphical editor, right in the place where you want to put the point.
- Now you can move this point aside by dragging it with the mouse.
To remove the salient point
- Double-click the salient point.
To move the end/salient point
- Drag this end/salient point aside.
To visualize flow value with a chart
- Right-click the flow element in the graphical editor and select Create Chart from the context menu, then select the desired chart type in the submenu. Here you can build either a bar chart or a time plot.
- The chart will appear in the graphical editor. You will be able to configure it in the Properties section.
If required, you can visualize the flow value using other AnyLogic charts from the Analysis palette.
-
How can we improve this article?
-