

First, we will create a simple model simulating how cars drive along Tapiolavagen in the Northern direction.
Create a new model
- Click the
 New toolbar button. The New Model dialog box is displayed.
 - Specify the name of the model. In the Model name edit box, type Road Traffic Tutorial.
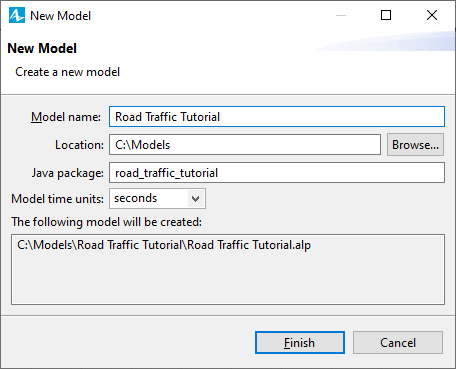
- Specify the location where you want to store your model files. Browse for the existing folder using the Browse button, or type the name of the folder you want to create in the Location edit box.
- Select seconds as the Model time units.
- Click Finish to complete the process.
New model is created. It already has one agent type called
![]() Main and one experiment called
Main and one experiment called
 Simulation experiment. Agents are the main building blocks of AnyLogic model. In our case the
![]() Main agent will serve as the place where will define all the logic of the model: here we will draw road network and define the car traffic process using a flowchart.
Main agent will serve as the place where will define all the logic of the model: here we will draw road network and define the car traffic process using a flowchart.
In the center of the workspace you will see the graphical editor. It shows the diagram of the
![]() Main agent.
Main agent.
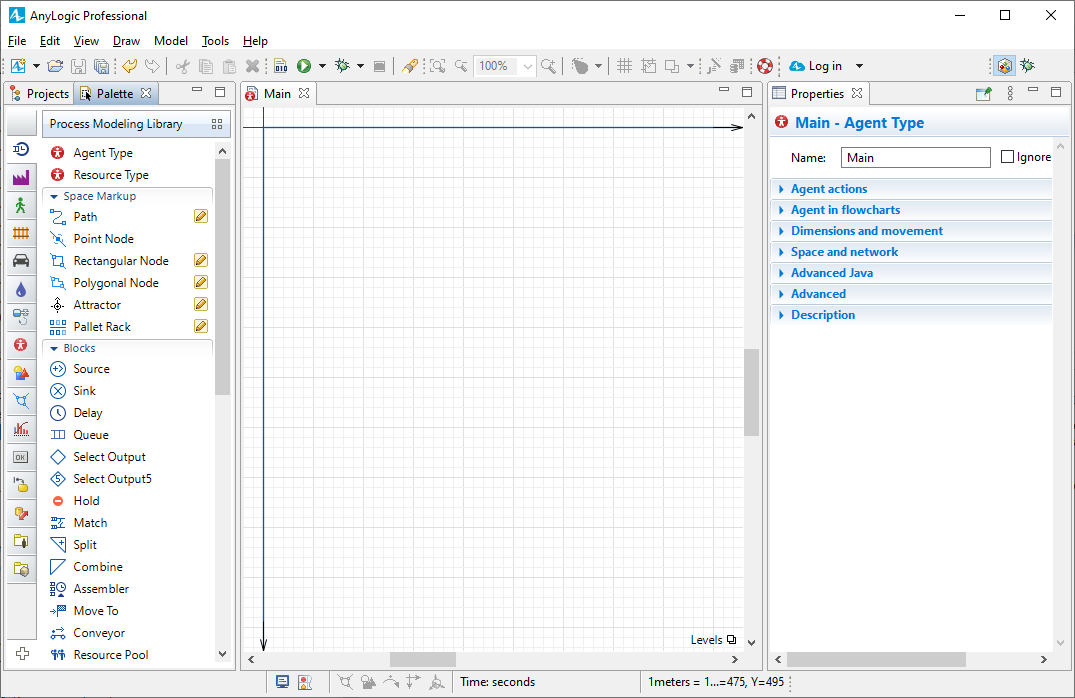
To the left of the graphical editor you can see the Projects view and the Palette view sharing the same area. The Projects view provides access to AnyLogic models currently opened in the workspace. The workspace tree provides easy navigation throughout the models. The Palette view contains all graphical elements, which you can add onto the graphical editor of your agent just by dragging and dropping. Model elements are grouped by categories in a number of palettes.
On the right side of the workspace you can see the Properties view. The Properties view is used to view and modify the properties of a currently selected model element(s). When you select something — e.g., in the Projects view or in the graphical editor — the Properties view displays the properties of the selection.
Now we can start developing the model.
The typical scenario is the following:
- Add a layout of the simulated space (as image) on the model canvas.
- Draw roads on top of the layout.
- Define the car movement process using the Road Traffic Library flowchart blocks.
Let’s build a simple model by following these steps.
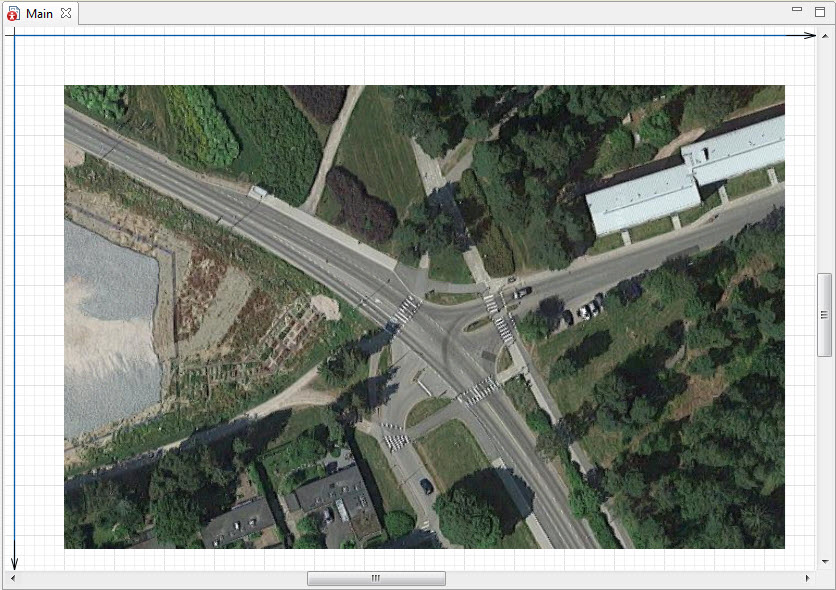
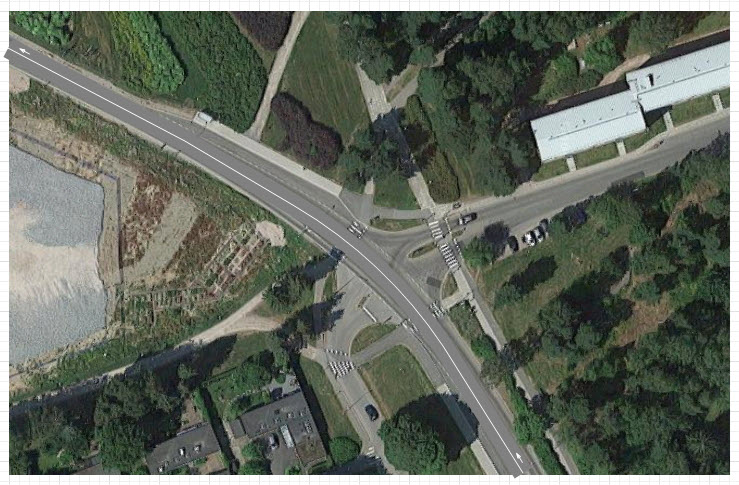
We will use the following layout:
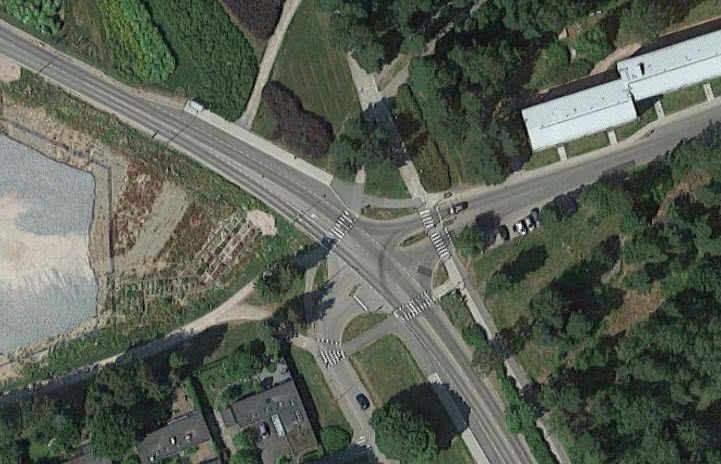
Save the layout image to your computer
- Right-click the image above, click Save image as and select the location for the image file.
Now we can add this image on our model’s canvas.
Add the layout on the canvas
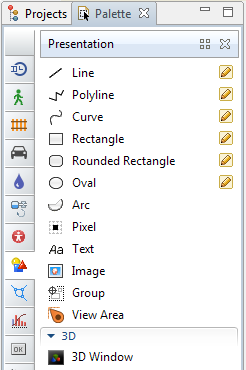
- First, open the Presentation palette of the Palette view. This palette contains shapes, which you can add on your presentation. To open a palette, just click on the corresponding icon in the vertical ribbon docked to the left part of the palette. While you are not accustomed to the palette icons, you may hover the mouse over the ribbon and wait for the popup window to appear. It will show you the names of all palettes.
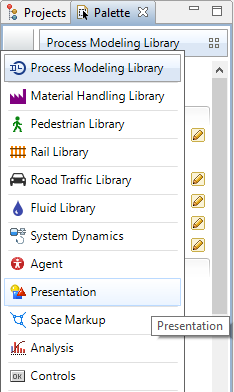
- Select the Presentation palette to open it:
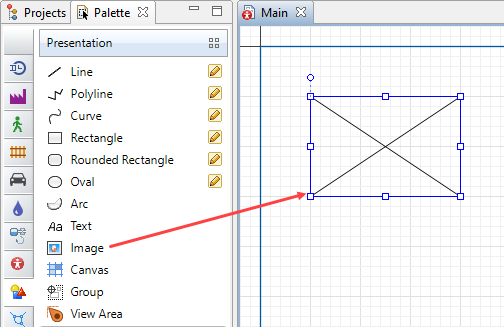
- Drag the
 Image element from the Presentation palette on the graphical diagram.
- Choose the image file to be displayed by this shape. The file browser will open automatically. Browse to the folder where you just saved the layout image file, select it, and then click Open in the dialog box. You will see the drawing displayed in the graphical editor:
Now we will draw the road (Tapiolavagen), placing it exactly over a road on the layout. That is how you define road networks in AnyLogic: draw roads, intersections, and optionally add other space markup elements (bus stops, stop lines and parking lots).
Draw a road
- Before you draw the road, we advise you to switch off the grid alignment in the graphical editor. Click the Enable/Disable Grid
 .
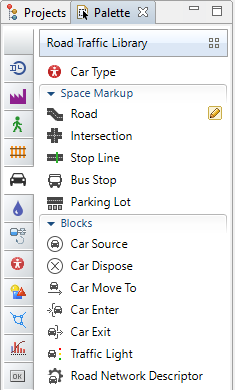
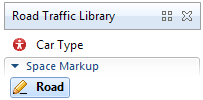
. - In the Palette view, switch to the
 Road Traffic Library palette:
- Double-click the
 Road element in the Space Markup section of
Road Traffic Library palette. The icon of the element should turn into
Road element in the Space Markup section of
Road Traffic Library palette. The icon of the element should turn into  . It means that the drawing mode is activated and you can now draw the road point by point in the graphical editor.
- Click in the graphical editor to draw the first point of the road.
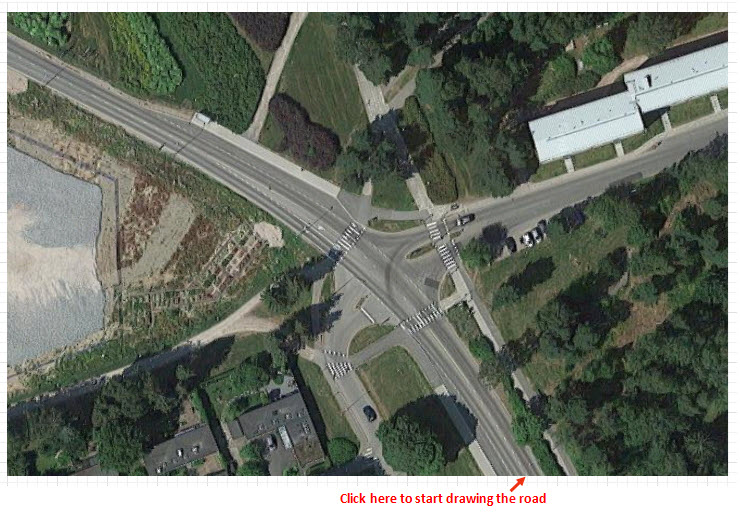
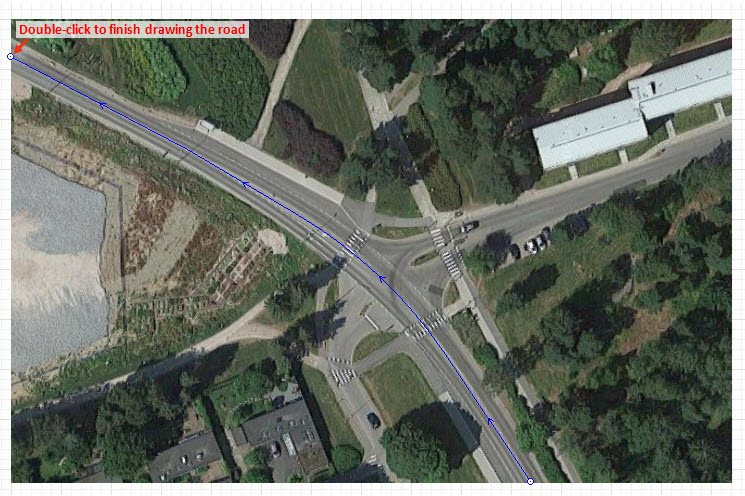
- Continue drawing the road segment by segment. Our road starts with a linear segment. To draw a linear segment, click in the place where you want to put the segment’s end point (see the figure below).
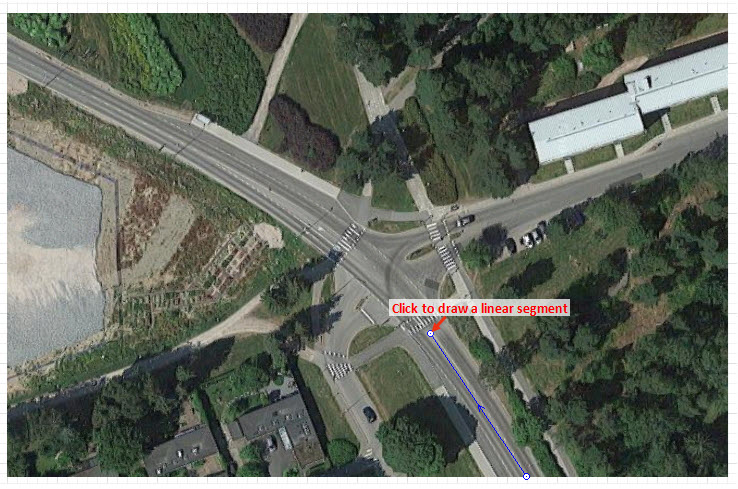
- The next segment of our road is curved. To draw a curved segment, press the left mouse button at the road’s next turning point (in the beginning of the next linear segment) and move the mouse with the left mouse button being pressed until you get the segment of the required shape. Release the mouse button when finished adjusting the form of the road segment.
- Finally put the last point of the road with the double-click.
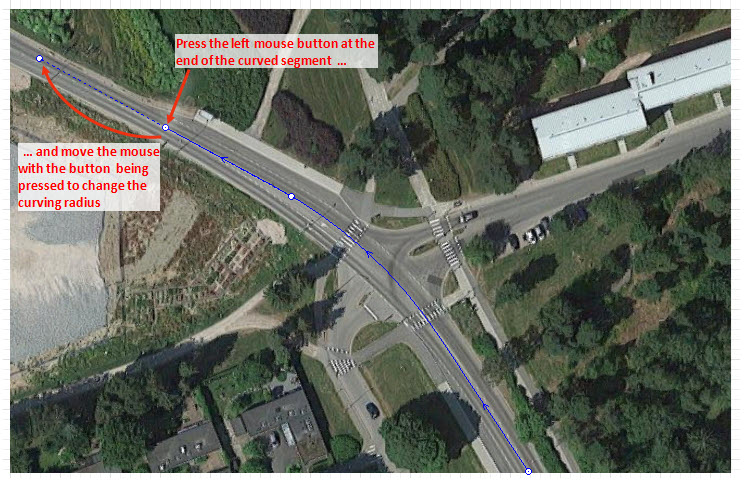
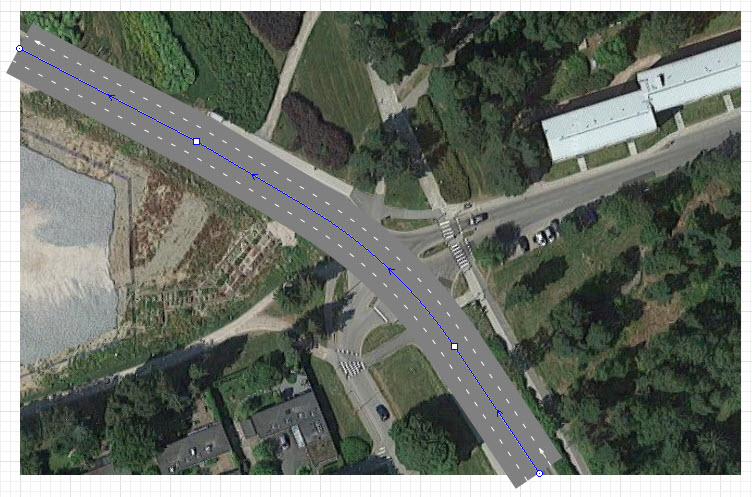
- If it is the first road in the model that you are drawing, you will see a message prompting you to change the model scale to: 4 pixels per 1 meter. We recommend you to follow this advice as the offered scale is frequently used in typical road traffic models. Finally you will see the drawn road. It should look like the one in the figure below:
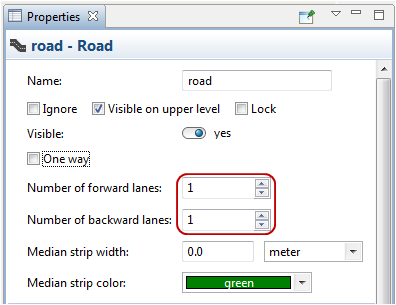
- Customize the road attributes in the Properties view. By default roads are drawn two-way with two lanes for cars moving in one direction (forward lanes), and two lanes for cars moving in the opposite direction (backward lanes). Our road (Tapiolavagen) has one forward and one backward lane, that is why you should change both Number of forward lanes and Number of backward lanes parameters to 1. The number of lanes will automatically decrease.
As you can see, the road is drawn opaque. Let’s make the road semi-transparent to double-check whether the resulting road perfectly matches the road on the map. The transparency setting (as well as traffic direction and lane width) is defined not in the road properties, but in the properties of the road network this road belongs to.
- Select the road network by clicking the road. The first click selects the road itself. The next click selects the road network. Having selected the road network, open the network’s Appearance properties. Click in the Road color control, choose Other Colors... from the list, and set the road color’s Transparency level to 150 as for instance.
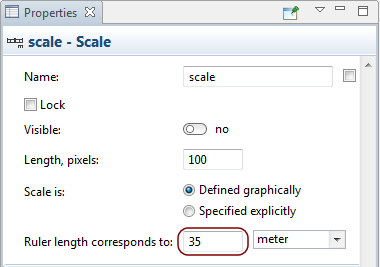
- Now you can see how the drawn road matches the road on the map. If it is more narrow or more broad, you should adjust the model scale. If needed, drag the canvas down to see the Scale element above the X-axis and adjust the model scale in its properties.
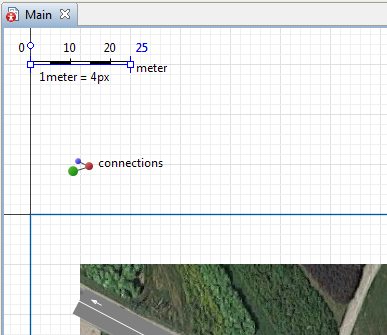
- In this example, we set the scale ruler to correspond to 35 meters.
- The road width will alter according to the changes you make. Finally you should get the road that looks like the one on the figure below:
Now we will define the traffic process with a flowchart composed from Road Traffic Library blocks.
Each block here defines some operation that will be performed with cars passing through this block.
In AnyLogic you create flowcharts by adding the blocks from the library palette onto the graphical diagram, connecting blocks together, and tuning the parameters of the blocks.
Create the process flowchart
- Open the
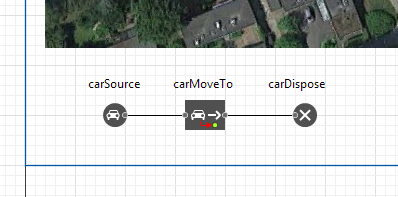
Road Traffic Library palette. Add Road Traffic Library blocks on the diagram and connect them as shown in the figure below. To add a flowchart block on the diagram, drag the required element from the palette into the graphical editor.
Let’s say a pair of words about these flowchart blocks.
-
 CarSource block generates cars. It is usually used as a starting point of the car flowchart.
 -
 CarMoveTo simulates and controls car movement to the specified destination.
 -
 CarDispose indicates the end of the flowchart and discards incoming cars from the model.
You can refer to Road Traffic Library Reference Guide for the detailed information about all Road Traffic Library blocks.
Configure the flowchart blocks
- To modify properties of some model element, first select it by clicking on it in the graphical editor. This opens the properties of this element in the
 Properties view.
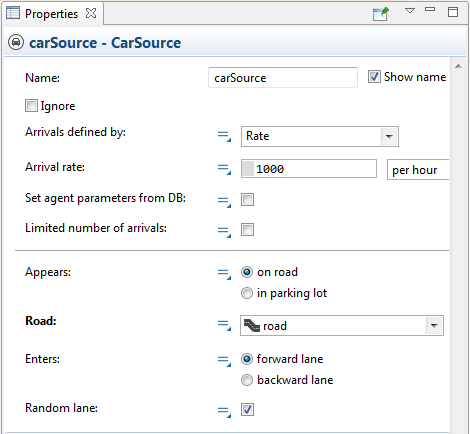
 - Select carSource block. In the
Properties view, specify how often cars arrive. In the Road drop-down list, select
road — it is the name of the road we have previously drawn. This way we tell this carSource block to place generated cars on this particular road.
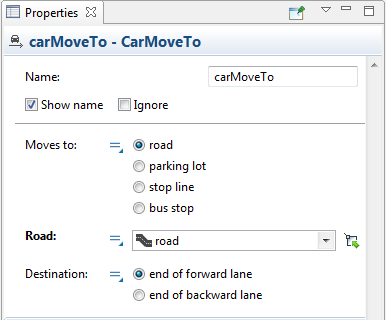
- Modify the properties of the carMoveTo. Leave the default setting Moves to: road and again select
road in the Road drop-down list. This block will simulate how cars drive along the specified road, up to the end of the road’s forward lane (it is set by the block’s parameter Destination).
- Leave the default properties for the carDispose block.
Now we are ready to run the model. First, build your model by clicking the
 Build model toolbar button. If your model contains errors, the building of the model will fail and the Problems view appears listing all the errors found in your model. Double-click an error in the list to open the location of the error and fix it.
After the model is successfully built, you can start it. Running the simulation, you automatically bring the current model up to date.
Run the model
- Click the
 Run toolbar button and choose the experiment you want to run from the drop-down list. Your simulation experiment is called Road Traffic Tutorial/Simulation.
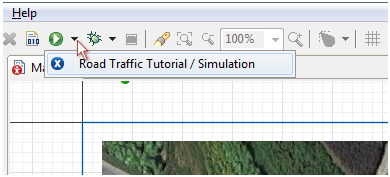
In our case this model is the only one opened in the workspace at the moment, as a result you will be prompted to run this particular experiment. Later, on pressing this button you will start the previously launched experiment. To run any other experiment, right-click (macOS: Ctrl + click) the experiment in the Projects view and choose Run from the context menu.
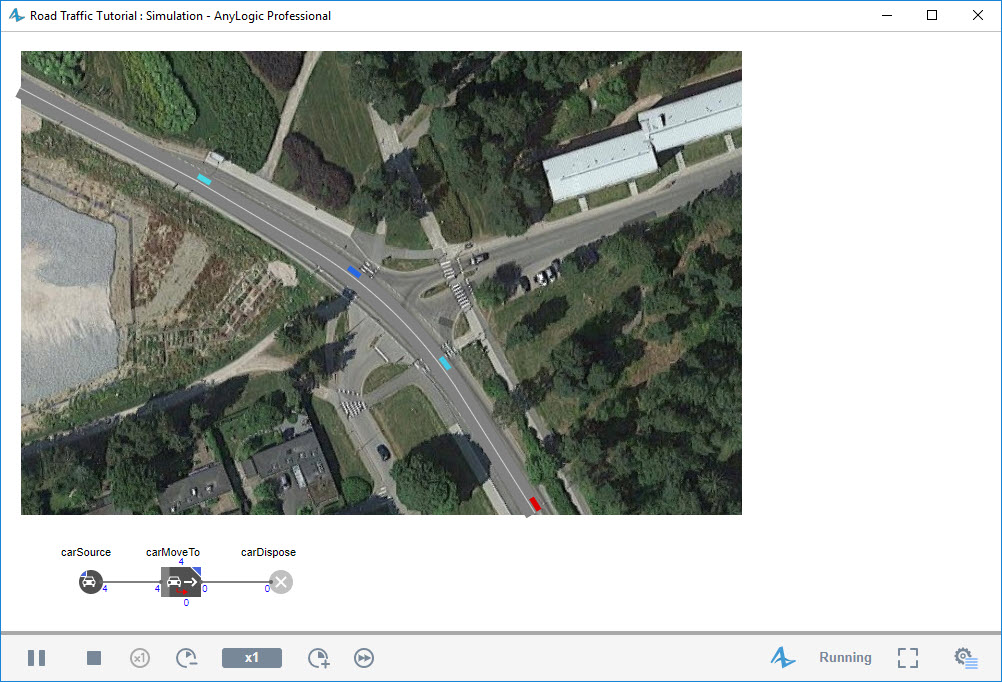
On starting the model, you will see the model window. It displays the presentation of the top-level agent type (by default, it’s
![]() Main). Observe the process dynamics. You will see how cars move in 2D animation, over the layout image. If needed, adjust the execution speed to your needs using
Main). Observe the process dynamics. You will see how cars move in 2D animation, over the layout image. If needed, adjust the execution speed to your needs using  slow down and
  speed up controls.
You will also see the animated flowchart. Each model created with Road Traffic Library instantly acquires animated flowchart showing the number cars which passed through the block, and the number of cars that is currently inside this flowchart block.
-
How can we improve this article?
-