

- Step 1. Creating a new action chart
- Step 2. Adding a loop performing iterations over balls
- Step 3. Adding a “decision” block
- Step 4. Adding a “code” block
- Step 5. Adding local variables
- Step 6. Checking whether the balls are in collision distance
- Step 7. Checking whether the balls are moving towards
- Step 8. Specifying return values
This tutorial will demonstrate you how to create action charts — structured block charts allowing defining algorithms graphically in the style of structured programming. Action charts are very helpful since using them you can define algorithms even if you are not familiar with syntax of some Java operators. Moreover, action chart gives you one more evident benefit: it visualizes the implemented algorithm, making it more intuitive to another users.
To simplify the teaching process we will build an action chart in the existing model — Billiard Balls. In this model several balls move within a 2D rectangular area. The balls elastically rebound from each other and from the area borders.
We will create an action chart defining an algorithm that is implemented in the current model using the checkHit() function. This algorithm checks whether a given billiard ball has collided with some other ball at the moment.
The algorithm loops over all balls present in the model (they are defined as a collection of agents of type Ball) and checks the conditions evidencing the ball collision. Two conditions should be met: the distance between the balls should be less than the ball diameter, and the balls should move towards each other. If the collision will be detected, the action chart will return the ball that collided with the given one.
Prepare the model for the tutorial
-
Choose Help >
 Example Models from AnyLogic main menu.
- You will see Example Models tab of the Welcome page opened.
- Click the Billiard Balls link to add this model to the workspace.
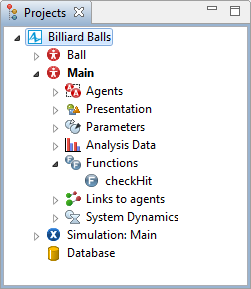
- In the Projects view tree, expand the Billiard Balls branch, then the branch of the Main agent type and finally Functions branch.
-
Right-click (macOS: Ctrl + click) checkHit function and choose Delete from the popup menu.
- Save the model to another location on the disk using the Save As... command. We need this to make sure that our modifications will not affect the example model.
First, you need to activate the  Actionchart palette in the Palette view.
To activate the Actionchart palette
-
Navigate to the bottom of the Palette view and click the button.
-
Select the Actionchart item from the displayed menu of available palettes and click it.
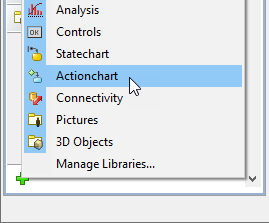
- Actionchart palette will appear in the Palette view.
Create a new action chart
-
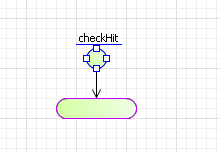
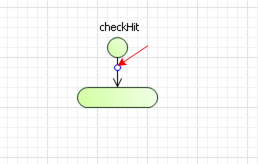
Drag the
 Action Chart element from the Actionchart palette onto the graphical diagram of agent. You will see new action chart (the
basic construction consisting of a starting point and "return" block) drawn.
Action Chart element from the Actionchart palette onto the graphical diagram of agent. You will see new action chart (the
basic construction consisting of a starting point and "return" block) drawn.
-
Change the name of the action chart: type checkHit and press Enter when finished.
- Define the properties of the action chart in the Properties view.
- Specify the type of the value your action chart will return. In our case we want to return the ball that bounced with the given one. So, we need a value of the custom Java class to be returned. Choose Other option from the Return type group of buttons. Type the required type name in the edit box to the right. Since in the Billiard Balls model balls are defined as agents of type Ball, type Ball here.
- Now we need to define an argument for the action chart since we want to pass a ball to the implemented function. Action chart arguments are defined in the Arguments table. Type the argument name in the Name cell: b. Specify the type of the argument in the Type cell: click in the cell and choose Ball from the drop-down list.
Now you have created the simplest action chart. From this point on, you should insert required blocks into their places inside the created action chart according to the logic of the algorithm you are implementing.
To find collisions of a given ball, we need to iteratively check all balls present in our model. So now we need to add a loop to our algorithm that will iterate through all balls present in the model and check the collision conditions.
The best way to loop through a collection of objects is to use the For Loop. There are two forms of a "for loop" — Generic and Collection iterator. As its name says, Collection Iterator allows iterating through a collection. On each iteration you can perform a set of actions with next in turn collection item.
Insert a "for loop" into action chart
-
Drag the
 For Loop from the Actionchart palette into our action chart.
-
While moving the mouse over the graphical editor you will see insertion points of action chart indicated with little blue circles. In this tutorial we will help you to find the correct insertion points by providing you with illustrative figures. We will indicate the required insertion points on these figures with red arrows. Release the mouse button over the indicated insertion point. New "for loop" block will be inserted into this place.
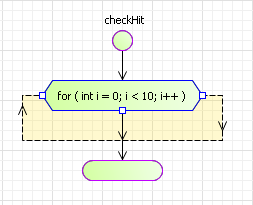
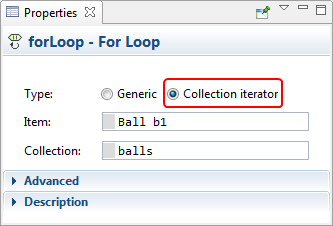
- Go to the Properties view and specify the type of the loop. Since we want this loop to iterate through a collection, choose the Collection iterator option.
- Specify the collection you want to iterate through, in the Collection field. Type the name of our collection: balls (you may use code completion assistance).
-
In the Item field, specify the class of the collection item and the name, which you will use to access the next in turn collection item in the "loop" iteration. Type Ball b1 here.
-
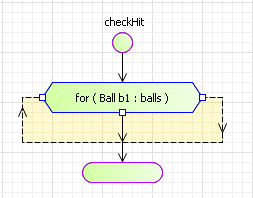
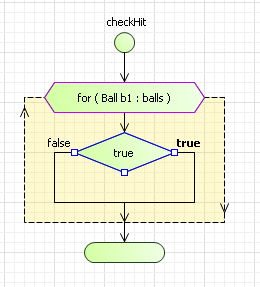
The properties of the "for loop" will be modified on the diagram as well:
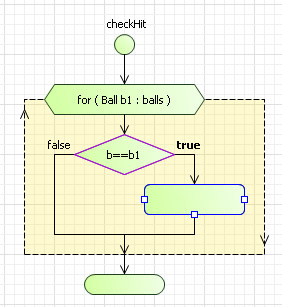
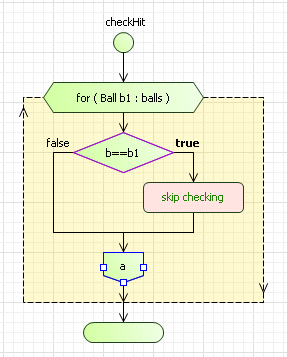
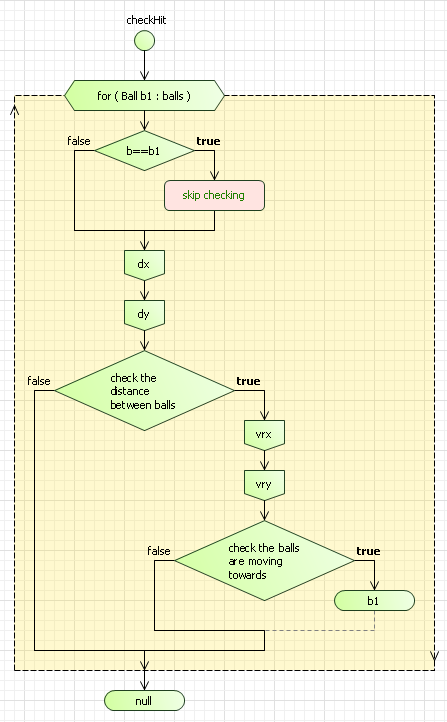
When performing our iterations, we inevitably will face the situation when the we will check the collision of the ball with itself (since all balls reside into the same balls collection). We want to prevent this by checking whether the ball passed as the action chart argument is the same as the ball the "for loop" is currently checking. We will implement this check using the Decision block.
Decision block is the easiest way to route the algorithm flow. The block has two exit branches — true and false. You can define any sequence of actions for either of the two branches using other action chart blocks. When the control reaches the "decision" block, it decides which branch to take. If the condition defined for this "decision" block is met (i.e. it evaluates to true), true branch is taken. Otherwise, false branch is taken.
Insert a "decision" block
-
Drag the
 Decision element from the Actionchart palette onto the diagram onto the insertion point inside the "for loop":
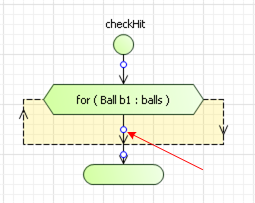
-
New "decision" block will be inserted into this place.
-
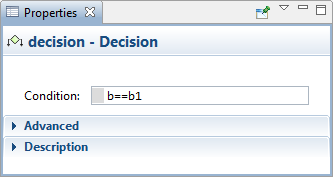
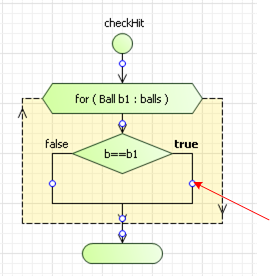
Go to the Properties view and specify the condition in the Condition field. Condition is Java expression that produces a boolean result. Type b==b1 here. You will see the condition shown inside the block on the diagram.
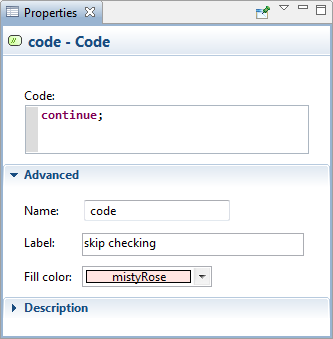
Now we want to skip our procedure of founding the ball collisions in the case we compare the ball with itself. We need just to place one string of code in the branch of the action chart that will be taken if the result of our condition will be true. We add code snippets performing some actions into the action chart using Code blocks. Code can be either a simple Java statement, or a set of statements, each one terminated by a semicolon. This code will be executed when the action chart control will reach the "code" block.
Insert a "code" block
-
Drag the
 Code element from the Actionchart palette into the insertion point located in the true branch of the "decision" block.
-
New "code" block will be inserted into this place.
-
Go to the Properties view. In the Code field, type Java code you want to be executed when the control of the action chart will reach this block: continue;.
This code will be shown inside the block on the diagram.
- Now we will add some comments for this code to make the algorithm easier to understand. Type skip checking into the Label field.
-
Optionally, you can change the fill color of the "code" block using the Fill color control.
-
All the modifications will be reflected on the diagram, so finally it should look like in the figure below:
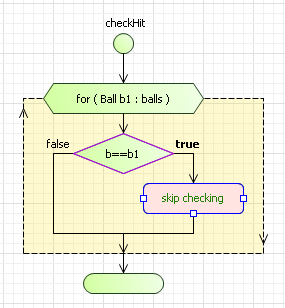
Now our action chart will skip checking collisions of the ball with itself and will continue iterating through the collection of balls.
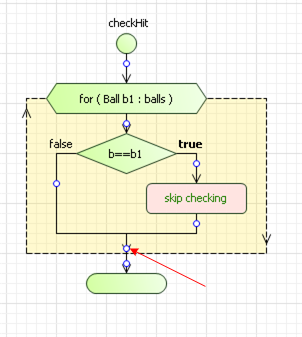
Now we want to implement the first collision condition — check that the balls are in the collision distance (the distance between the balls is less than the ball diameter).
For that, first we will declare a pair of local variables to store intermediate calculation results. Variables in action charts are defined using Local Variable blocks.
Declare a local variable
-
Drag the
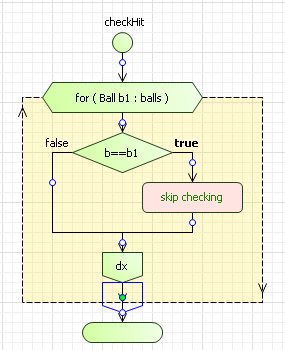
 Local Variable from the Actionchart palette into the insertion point at the bottom of the "for loop" area:
-
New "local variable" block will be inserted into this place.
- Go to the Properties view.
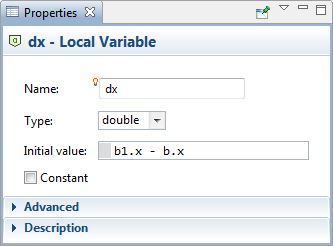
- In the Name edit box, type the name of the local variable: dx. The name of the variable will be shown inside the block on the diagram.
- Specify the type of the local variable. Choose double option from the Type list.
-
Specify the variable's initial value in the Initial value edit box: b1.x - b.x
Declare another local variable
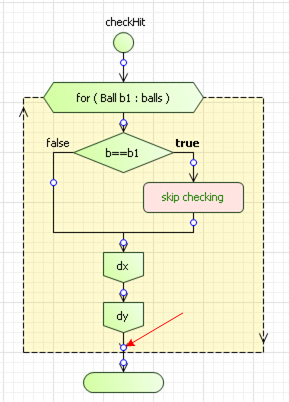
- Add one more local variable below. We will create it by copying the just created one.
- Right-click (macOS: Ctrl + click) the dx variable block and choose Copy from the popup menu.
- Then right-click (macOS: Ctrl + click) on the empty place of the diagram and choose Paste. The copy of the variable block will appear on the diagram.
- Drag it into the action chart below its original block.
-
Drop it when the cursor will be over the green circle on the branch coming from the dx variable block.
-
Modify the properties of the created variable. Name it dy and specify the Initial value: b1.y - b.y.

Insert one more "decision" block
-
Place one more "decision" block below the variables.
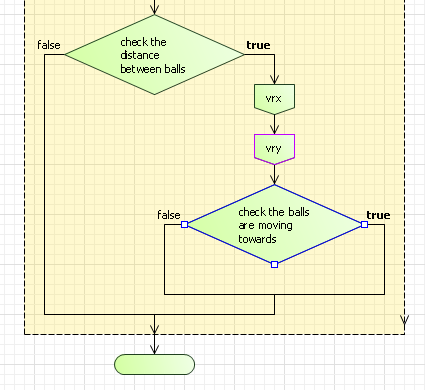
- Specify the condition in the Condition field: dx*dx+dy*dy < 4*b.r*b.r
-
In the Label field, type the comments:
check the distance between balls
They will be shown inside the block instead of the condition.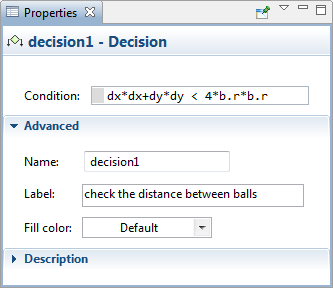
-
Finally, resize the block to fit the comments:
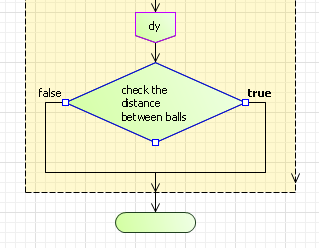
Now we need to check the second collision condition — that the balls are moving towards each other at the moment. We will implement this checking in the same way as the first one — first, we will declare some local variables and then add a "decision" block to perform checking the condition itself.
Declare two local variables
-
Add two local variables in the true branch of the just created "decision" block like shown on the figure below:
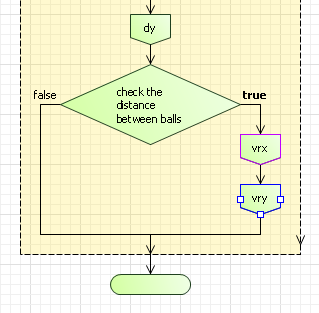
- Make both variables double.
- Name the first one vrx and specify the Initial value: b1.vx - b.vx
- Name the second one vry and specify the Initial value: b1.vy - b.vy
Insert one more "decision" block
-
Place one more "decision" block below the vry variable:
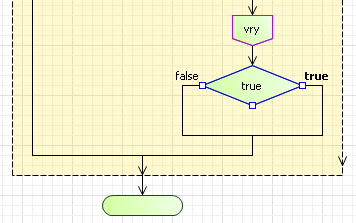
- Specify the Condition: dx*vrx+dy*vry <= 0
-
Type your comments into the Label field:
check the balls are moving towards -
Finally, resize the block to fit the comments:
Now we need to specify values that our action chart will return. This can be done using Return blocks. Return block plays two roles: it specifies the value the action chart will return (if it's return type is not void) and also causes that value to be returned immediately.
First, in the case we have found a ball collision, we should return the ball that has collided with the one passed as the action chart argument.
Insert a "return" block
-
Drag the
 Return from the Actionchart palette into the true branch of the just created "decision" block. You can see that this branch will be drawn dashed to denote that control will never take this way.
- In the Properties view, type b1 in the Return field.
Each branch of the action chart should end with the Return block. That is the reason that when we started drawing an action chart, one "return" block was automatically included into the action chart to make the construction complete. The control is passed to this block when the algorithm will be finished and no ball collisions were found, so we need to return null here.
Specify the return value of the action chart
- Select the "return" block that is located at the bottom of our action chart.
- In the Properties view, type null in the Return field.
Now we have finished building our action chart. Finally, it should look like as in the figure below:
Action chart is called in the same way as a function — you write the action chart name followed by parenthesis, specifying the action chart arguments inside the parenthesis. So, all calls of the function checkHit() in this model will call our action chart now. You can run your model and check that it will work as before with the checkHit() function. But now your algorithm will be more intuitive to other users of your model.
-
How can we improve this article?
-