

You place charts on the presentation diagram of either agent type or experiment. Each chart should be placed on unoccupied area of the diagram, since they cannot overlay one another.
When you add chart on the diagram, you see it displayed as a chart pattern lying inside rectangle border. This border defines the area allotted for the chart and all its accompanying elements (legend and axis labels).
To resize a chart shape area
- Select the chart shape on the diagram by clicking it. You will see several blue rectangles displayed on the shape’s border.
- Drag the rectangle located on the shape border that you want to move (or on the corner of the border, if you want to move two borders at once) with the left mouse button.
- Alternatively, in the Position and size section of the Properties view, enter the shape’s height and width in the Height and Width fields correspondingly.
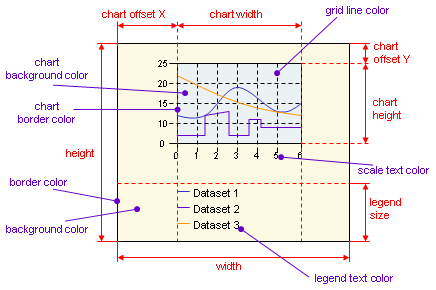
When resizing the chart shape area, the chart area will be also resized in accordance with the chart offset settings.
The position of the chart itself inside this area is defined by the following two parameters: X-offset and Y-offset. Y-offset defines the offset of the chart from the top of the chart shape, while X-offset — the offset from the left border.
To adjust chart area offsets
- Select the chart shape on the diagram by clicking it.
- Go to the Chart area section of the Properties.
- Specify offsets in X Offset and Y Offset boxes correspondingly.
To resize a chart area
- Select the chart shape on the diagram by clicking it. You will see several blue rectangles displayed on the border of the chart pattern.
- Drag a rectangle located on the pattern border that you want to move (or on the corner of the border, if you want to move two borders at once) in the required resize direction.
- Alternatively, in the Chart area section of the Properties view, enter the shape’s height and width in the Height and Width boxes correspondingly.
-
How can we improve this article?
-