

AnyLogic supports full integration of all simulation methods, and provides you with the unique ability to make agents living in GIS space also pass through the process flowcharts defined with Process Modeling Library blocks.
In this article we will describe all common tasks related to GIS — process-centric integration.
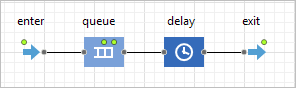
You have agents living in GIS space, and want them to pass through process defined with a flowchart. You can easily insert GIS agents into a flowchart by using the Enter block of Process Modeling Library. In this case typically you may need to end the flowchart with Exit block, not to delete the agents leaving the flowchart with Sink (see the figure below). To insert agent in a flowchart starting with Enter block, use the block’s function take(), passing the agent as the function argument, e.g. enter.take(truck);.
All the Process Modeling Library blocks that generate new agents (Source, Enter, Assembler, Batch, Split) allow modelers to place the generated agents in GIS space, in the specific point on the map. To learn how to define a new GIS location, see the section below.
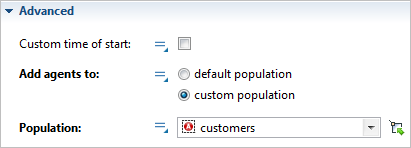
Moreover, you can add generated agents to some specific agent population. In the first Advanced section of the flowchart block, choose Add agents to: custom population, and choose the population from the Population drop-down list below.
When your GIS agent resides in a Process Modeling Library flowchart, you can make it move to a new GIS location using MoveTo flowchart block. To learn how to define a new GIS location, see the section below.
Process Modeling Library blocks support several ways of defining the GIS location for generated and moved agents.
You can define the new GIS location as:
-
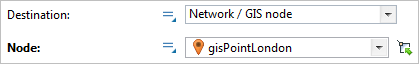
If you have marked the location on the map with a GIS point, or GIS region, you can choose the option Network / GIS node, and choose the name of the required GIS markup element from the drop-down list below. You may find it even simpler to click the
 button to the right of the list, and then select the GIS markup element by clicking it in the graphical editor.
-
Specifying the new location coordinates as Latitude, Longitude.
Latitude is measured in degrees: (-90 ... (South) ... 0 ... (North) ... 90)) .
Longitude is measured in degrees: (-180 ... (West) ... 0 ... (East) ... 180)).
Examples: London (51.3, 0.7), Sydney (-33.8, 151.1).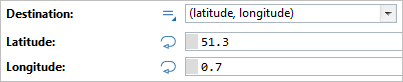
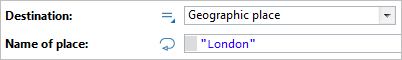
-
Referring to the location by its name. You may omit drawing GIS space markup shapes, and just specify the name in the Name of place field, as a text put in quotes: "London". The GIS map will search for a location with such name. The first location from the list of GIS search results will be used.
-
How can we improve this article?
-