

In this phase, we will create a model, then we will add and configure our first component — a GIS map.
To create a new model
- Click the
 New toolbar button. The New Model dialog box will open.
 - Specify the name of the model. Type Supply Chain GIS in the Model name edit box.
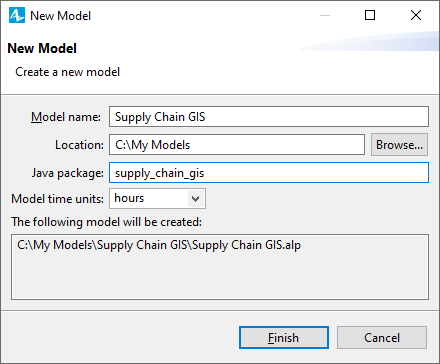
- Specify the location where you want to store your model files by clicking the Browse button, or by typing the name of the new folder that you want to create in the Location edit box.
- Select hours as the Model time units.
- Click Finish to complete the process of setting up the new model.
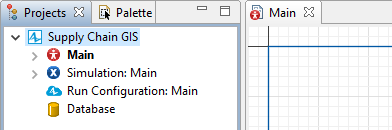
New model is created. Every new model by default contains two main components: the
![]() Main agent type and the
Main agent type and the
 Simulation experiment.
In the center of the workspace you can see the graphical editor. By default it shows the diagram of the
![]() Main agent type.
Main agent type.
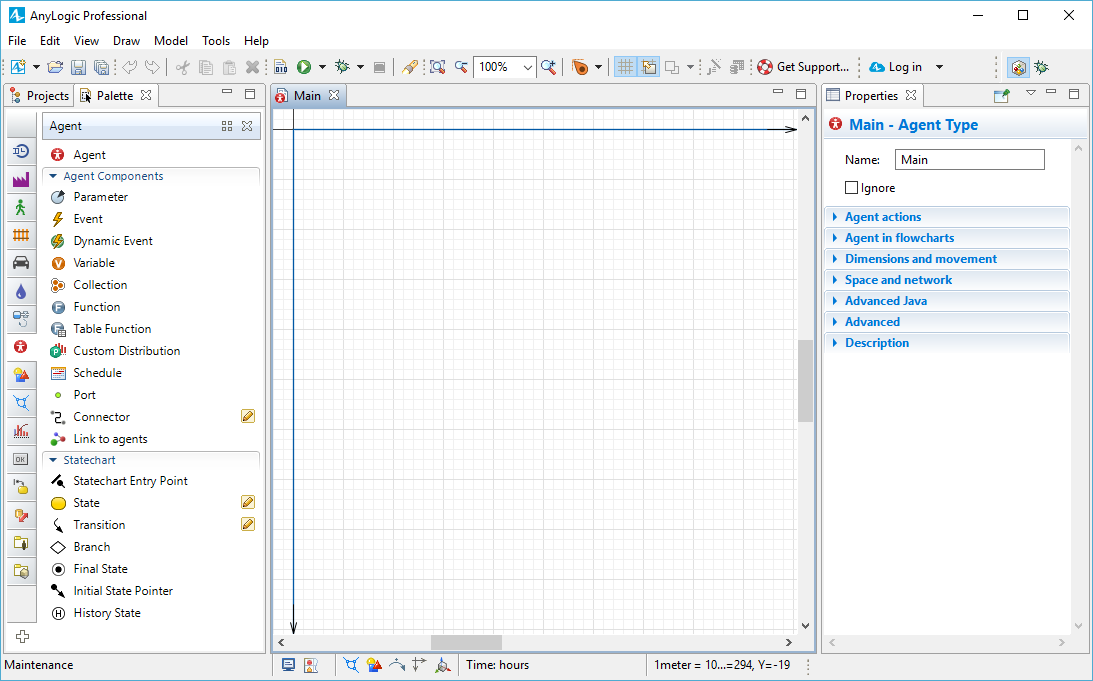
To the left of the graphical editor you can see the
 Projects view and the
 Palette view sharing the same area. The
Projects view provides access to AnyLogic models that are currently opened in the workspace. The workspace tree provides easy navigation throughout the models. The
Palette view contains all graphical elements that you can add onto the graphical editor of your agent simply by dragging and dropping. Model elements are grouped by categories in a number of palettes.
Palette view sharing the same area. The
Projects view provides access to AnyLogic models that are currently opened in the workspace. The workspace tree provides easy navigation throughout the models. The
Palette view contains all graphical elements that you can add onto the graphical editor of your agent simply by dragging and dropping. Model elements are grouped by categories in a number of palettes.
The right side of the workspace contains
 Properties view, which allows to view and modify the properties of the currently selected model element(s). If you select an item/element (in the Projects view or in the graphical editor), you can view its properties in the
Properties view.
Properties view, which allows to view and modify the properties of the currently selected model element(s). If you select an item/element (in the Projects view or in the graphical editor), you can view its properties in the
Properties view.
Now we can continue developing our model.
We will start with adding a GIS map onto the
![]() Main agent diagram, that is where all the further created agents will live.
Main agent diagram, that is where all the further created agents will live.
To add a GIS map
- By default the
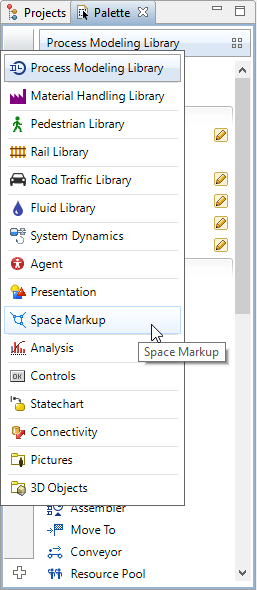
 Process Modeling Library is open. Hover your mouse over the vertical navigation bar and select the
 Space Markup palette.
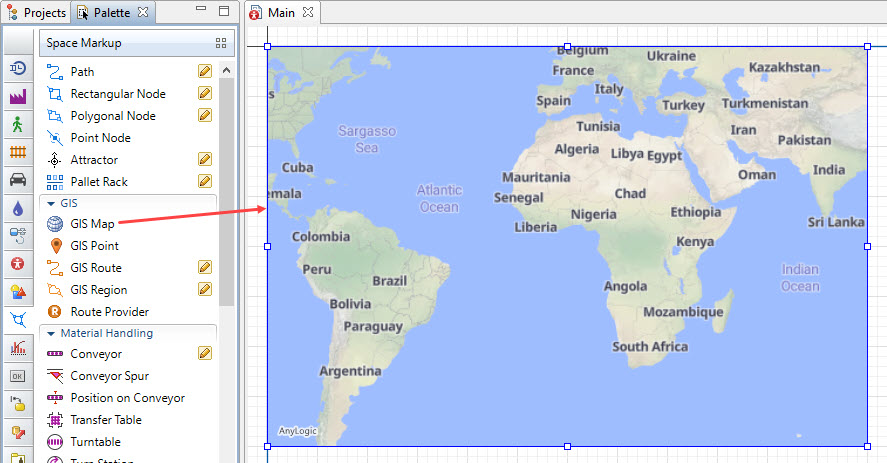
- In the
Space Markup palette, find the GIS section, and drag the
 GIS Map shape from the palette onto the graphical editor.
By default the GIS map displays the world map using tiles. We will use the default configuration of the
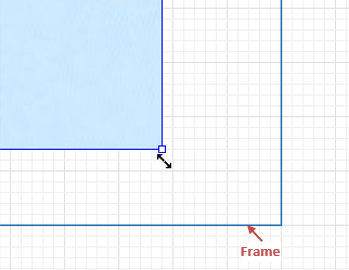
GIS Map shape in AnyLogic. - Let us change the map size to make it correspond to the size of the model window. Drag the rectangular handles to resize the GIS map in the graphical editor. The model window border is marked with the blue frame on this agent’s diagram, which defines the size of the presentation window and the part of the graphical diagram that is shown in the window at the model runtime.
Another popular technique is to turn off panning of the model window, leaving only the map panning at the runtime.
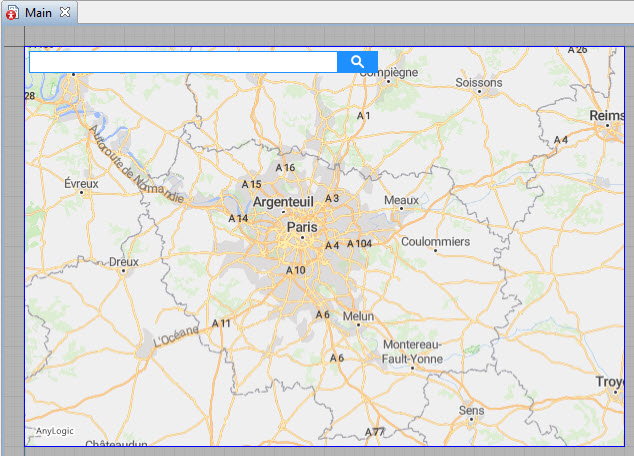
- In our model the supply chain is located in France, so let’s set the map to display France specifically. Double-click the map, or right-click it to further select Edit map from the context menu. You will enter the map editing mode, the map will remain highlighted unlike the rest of the graphical editor. Now you can navigate the world map to select the desired area:
- To pan the map, hold down the left mouse button as you move it.
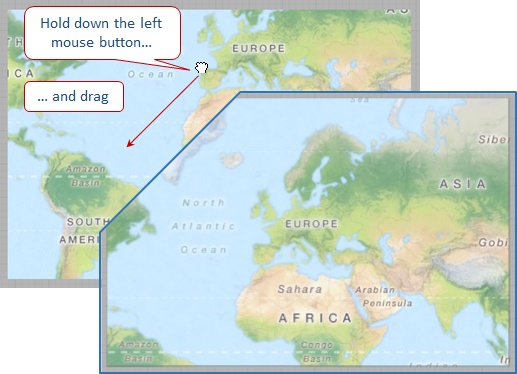
- To zoom in or out, scroll the mouse wheel up or down respectively.
- To pan the map, hold down the left mouse button as you move it.
- To exit the map editing mode, click the grayed out area outside the map, or right-click the map and select the Finish map editing option from the context menu.
Next, we will create several agents and place them on the map.
The supply chain that we model contains one distribution center, several retailers spread across the country, and a fleet of trucks that deliver the product from the distributor to retailers.
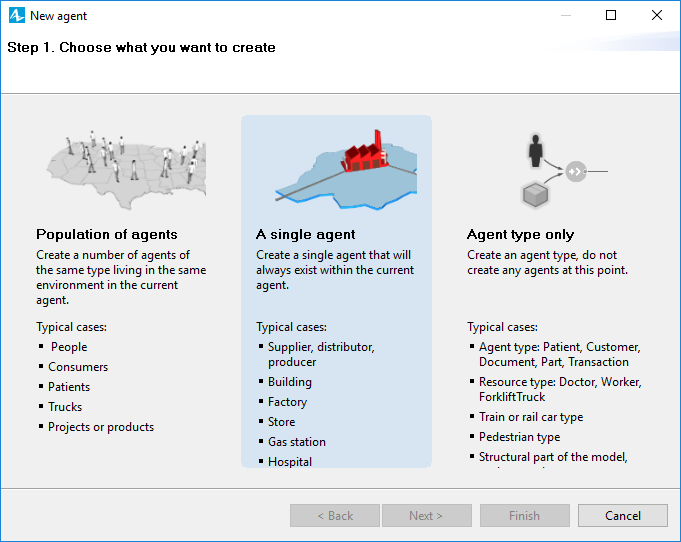
You can choose among the following three options when creating an agent: a population, a single agent, and an agent type. Each option presupposes that you will create an agent type anyway, but the population and the single agent options also automatically create agent instance(s) that are placed in some space, which is defined by the
![]() Main agent in our case. Unlike a single agent, a population is a collection of a certain number of agents of the same type.
Main agent in our case. Unlike a single agent, a population is a collection of a certain number of agents of the same type.
To make an agent type play the role of a space for other agents, you create those agents on its diagram.
Since we model only one distribution center, let us create it as a single agent.
Create a distribution center
- Open the
 Agent palette in the
Palette view. Drag the
Agent palette in the
Palette view. Drag the
 Agent element onto the
Main diagram. The New agent wizard will pop up.
Agent element onto the
Main diagram. The New agent wizard will pop up.
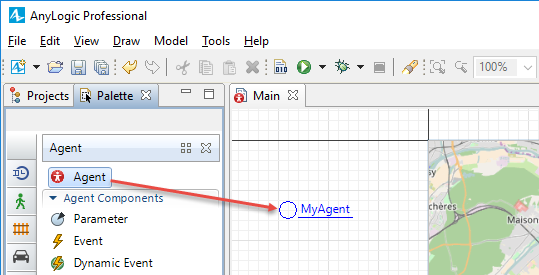
- Choose to create A single agent. The wizard will take you to the next step.
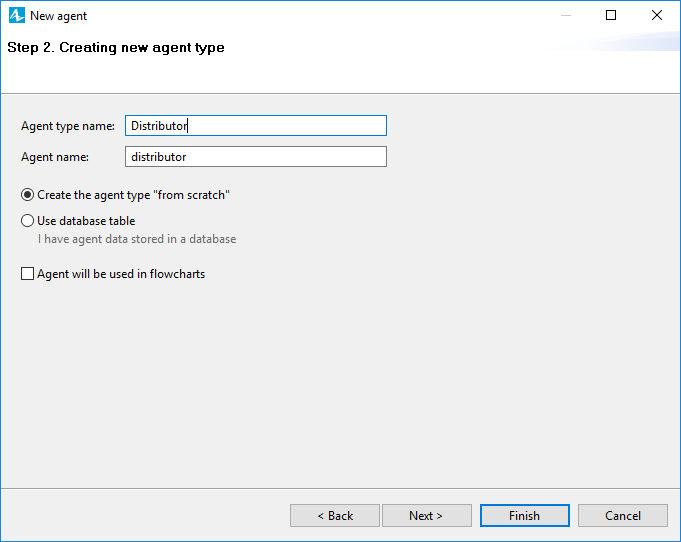
- Type Distributor in the Agent type name field. The specified name will autofill the Agent name field with distributor. Click Next.
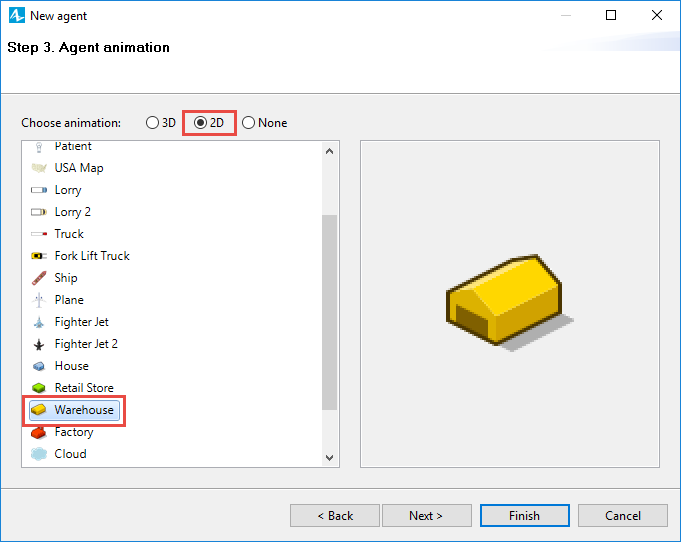
- Now we will choose Agent animation. Since we are using GIS map, we should use 2D animation. Click the 2D option and select the Warehouse figure. Click Finish.
The agent will appear on the
![]() Main diagram where we have dropped it from the palette. The agent animation shape will be placed somewhere on the map (we will define a specific location for it later).
Main diagram where we have dropped it from the palette. The agent animation shape will be placed somewhere on the map (we will define a specific location for it later).
There are several different methods that you can use to define an agent’s position on the map, from specifying the geographic coordinates of a certain point on the map to calling specific functions.
We will use GIS space markup shapes. This way you will define positions on the map with a couple of mouse clicks without writing any Java code.
Since we have only one distribution center, it makes sense to place it directly on the map.
To place a distributor in the specific GIS point
- Choose a location on the map where you would like to place the distribution center. You can zoom in to a smaller scale where you can even pick a certain address in a city. We will choose a location somewhere near Paris.
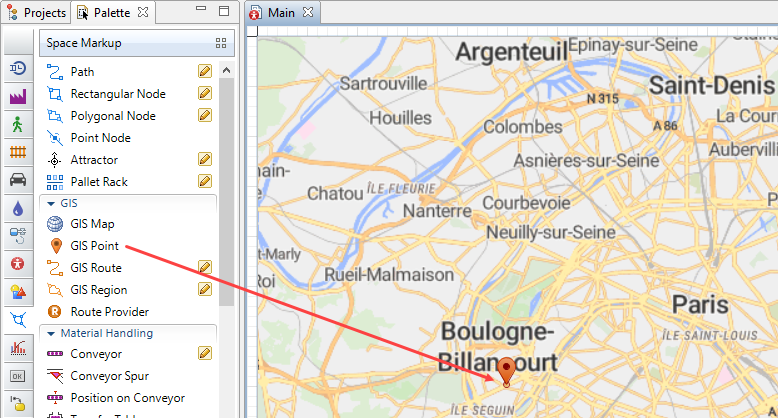
- Open the
Space Markup palette and drop the
 GIS Point on the chosen location on the map.
- Select the
distributor agent on the
Main and go to its Properties view.
- In the Initial position section of the agent’s properties, set the Place agent(s) parameter to in the node. Now we need to specify the node.
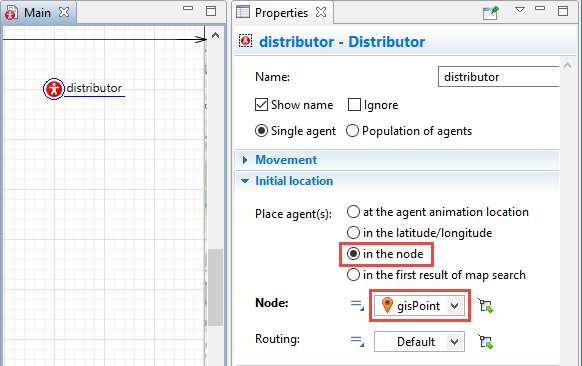
- Click the Node drop-down list and select the GIS point that we have previously created.
We have finished setting up the GIS Map shape on the agent’s diagram. Let us run the model and check the location of the distribution center.
To run the model
- Navigate to the
Projects view. If you see asterisk * next to the model’s name denoting unsaved changes, click the
 Save model toolbar button to save the changes in the model.
 - Build your project by clicking the
 Build model toolbar button. If the model contains errors, the building will fail and the
 Problems view will appear listing all the errors found in your model. Double-click an error in the list to open the location of the error and fix it. After the model is successfully built, you can start it.
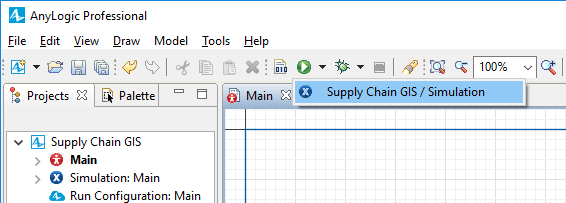
 - Choose the experiment you want to run from the drop-down list of the
 Run toolbar button. Your simulation experiment is called Supply Chain GIS / Simulation. Later on you can use the
Run toolbar button to start the previously run experiment.
Run toolbar button. Your simulation experiment is called Supply Chain GIS / Simulation. Later on you can use the
Run toolbar button to start the previously run experiment.
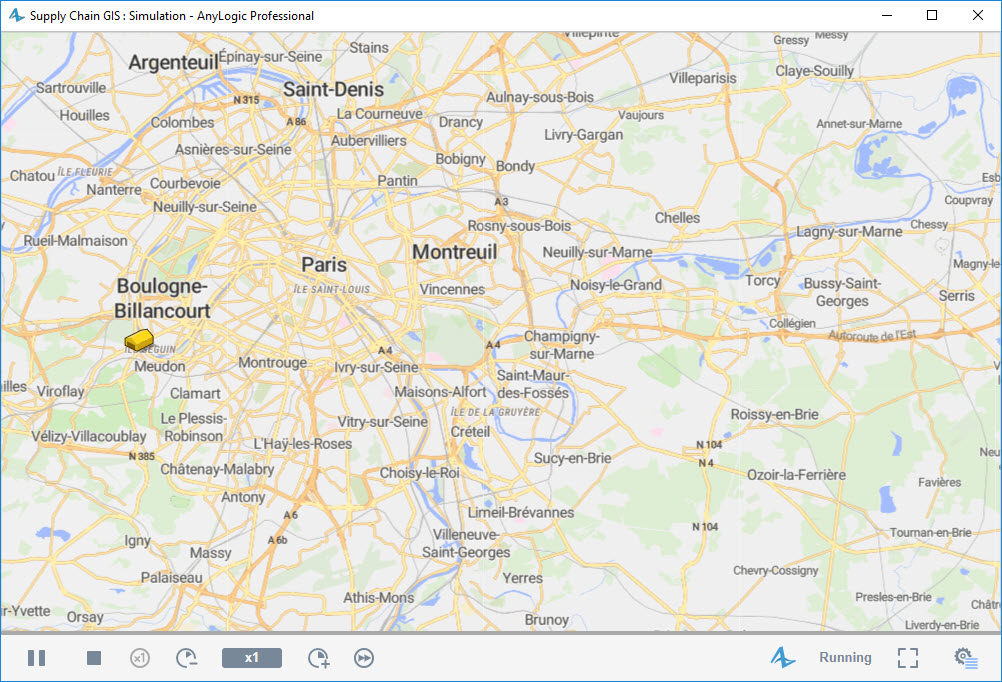
- You will see the model window. The model will run immediately, displaying the map. You should see the distributor located at Boulogne-Billancourt. You can navigate the GIS map at runtime using the same commands as at the design-time. As we run the model and navigate the map, the tiles are being cached into the model folder. As a result the model will be running much faster next time, because it will be using this cache.
You can compare your model to the reference model that we provide for every phase here:
Demo model: Supply Chain GIS — Phase 1 Open the model page in AnyLogic Cloud. There you can run the model or download it (by clicking Model source files). Demo model: Supply Chain GIS — Phase 1Open the model in your AnyLogic desktop installation.In the next phase we will create retailers and place them in particular locations on the map.
-
How can we improve this article?
-