

AnyLogic supports special type of functions — table functions. A table function is a function defined in the table form. You can simply make it continuous by interpolating and/or extrapolating. You may need table functions to define a complex non-linear relationship which cannot be described as a composition of standard functions, or to bring experimental data defined as a table function to a continuous mode.
Table function works in the following way: the user defines a function by giving a number of (argument, value) pairs, i.e. a number of base points on XY chart. AnyLogic builds the table function based on the given data and the chosen interpolation type. A call of a function with some value passed as a function argument, will return a (possibly, interpolated) value of the function. A number of behaviors are supported for the case x, which is out of original argument range.
To define a table function
- Drag the
 Table Function element from the
  Agent palette to the graphical editor.
 - Go to the Properties view and specify the function properties.
- Specify the name of the function in the Name edit box.
-
Define data for a table function in the Table data section of the
element’s properties. There are three alternative options:
- To load table data from the existing AnyLogic database, check the Loaded from database option and select the DB table from the Table drop-down list. If needed, define the conditions specifying the particular value you want to select from the database table in the Choice conditions option. Specify the Argument column and Value column by selecting the database table columns from the drop-down lists.
- If you have table data already defined in any other application or a file, you can simply copy it to clipboard and then paste it into the Table Data using the
 Paste from Clipboard button. Make sure to previously uncheck the Loaded from database option.
 - You can also enter the table data manually into the table (that is shown in the Table data properties section if the Loaded from database option is unchecked). Each “argument-value” pair is specified in an individual row of the table. To define pair of values, go to the last row of the table and enter the argument value in the Argument cell and the function value in the Value cell. To remove a pair of values, select the corresponding row of the table and click the
 Sort button.
- Specify how the table function should be interpolated using the Interpolation drop-down list in the general section of the properties.
- Specify how the table function should behave when its argument is out of range using the Out of range drop-down list in the general section of the properties.
The table function’s plot is displayed in the Preview section of the Properties view. Red area on the chart denotes the function’s infeasible area.
- General
-
Name — The name of the table function. The name is used to identify and access the function.
Show name — If selected, the function name is displayed on a presentation diagram.
Ignore — If selected, the table function is excluded from the model.
Visible — If selected, the table function’s icon is visible on the presentation at model runtime.
Interpolation — Specifies how the table function is interpolated:
- None — no interpolation applied.
- Step — step interpolation.
- Linear — linear interpolation.
- Spline — 4th order spline interpolation.
- Approximation — The resulting function is a polynomial of Order you specify in the edit-box on the right, formed in order the sum of the root-mean-square error in the points is minimal.
Out of range — Specifies how the table function’s behavior in infeasible area (when its argument is out of range):
- Error — runtime error is raised.
- Nearest — the function is extrapolated by using the nearest valid argument.
- Repeating — the function is extrapolated by making it periodic with the function range as a period.
- Custom — the function returns a custom value, defined in the Value field to the right.
- Extrapolate — the function is extrapolated outside the range in accordance to the interpolation type.
- Table data
-
Loaded from database — If set, allows to load data from the existing AnyLogic database defined by the user.
- Table — Here you can select the table of the AnyLogic database that contains the required data.
- Choice conditions — Here you define one or several conditions that will specify the particular values to be selected from the specified table column. You can add
 , duplicate
  , delete
  and arrange the conditions (
 ,
,  ).
). - Argument column — Here you define the argument column of the database.
- Value column — Here you define the value column of the database.
Table — Can be used to manually define data of the table function. Each “argument-value” pair is specified in an individual row of the table. You can add
, remove , arrange (, ) a pair of values, paste it from the clipboard or copy it to the clipboard. - Preview
-
Here you can see the function preview: the table function’s plot.
Red area on the chart denotes the function’s infeasible area.
- Advanced
-
Access — The access type of the table function. There are four access types:
- public — the function can be accessed from anywhere
- private — the function can be accessed from this agent type only
- protected — the function can be accessed from this agent type and its subclasses
- default — the function can be accessed anywhere within this model.
Static — [Only visible if Library developer mode is enabled] If selected, the table function is static. Static function is initialized once and has the same data for all instances of this agent type. This is very useful in agent based models, in case your agents have some table function defined. Making a table function static, AnyLogic engine does not waste time on initializing this function several times for numerous agents.
Do not use static table functions, if you plan to run iterations of complex experiments (optimization, parameter variation, etc.) in parallel on different processor cores (this is set by the experiment’s advanced option Allow parallel evaluations).
Static table functions are not saved into a snapshot file when you save/restore a state of a running model. If you do not alter the data of a static table function in your model, the state of the restored model will be exactly the same as you saved it into the snapshot. However, if you somehow change the data of a static table function (e.g. in agent’s On startup code), the modified data won’t be saved into a snapshot, and the restored state of the model will differ from the state you have previously saved.System dynamics units — If selected, you will be able to specify units of measurements for the value returned by this function in the edit box to the right. Having specified units for elements of your model, you may perform unit checking to find out dimension inconsistencies in the model.
To get the value of a table function for some argument, call the table function as any other function by its name, passing the argument value as the function parameter. For instance, if you have a table function named lookup1 in your model, to get the function value for the argument 5, call:
lookup1(5);
Alternatively, you can use the function get(double x) of the table function. For the example, considered above, the function call should be:
lookup1.get(5);
Both functions are identical. They return the table function value corresponding to the given argument, subject to the currently set interpolation type and out of range handling. In case the function only supports discrete values (that were provided as the argument set), and no interpolation is allowed, a call of such a function with an argument not matching any argument entry would result in exception thrown.
Table function can be interpolated.
To set up the function interpolation type
- Select the table function in the graphical editor or in the Projects view.
- In the Properties view, choose the corresponding interpolation type from the Interpolation drop-down list.
The possible interpolation types are listed below.
| Interpolation type | Description and example |
|---|---|
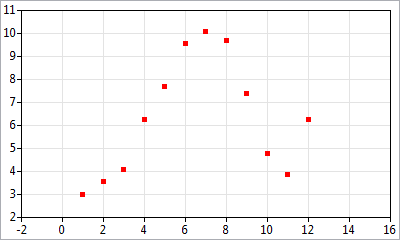
| None |
No interpolation applied.
|
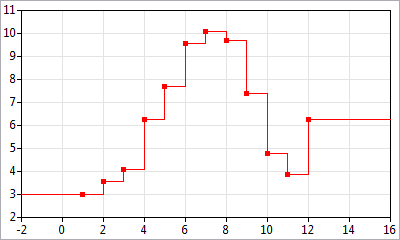
| Step |
Step interpolation. The function value between two points is the same as in the point with less argument value.
|
| Linear |
Linear interpolation. The points are connected with straight-line segments.
|
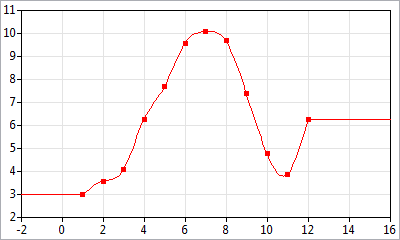
| Spline |
4th order spline interpolation. The points are connected with 4th order polynomial segments. For each point 0th, 1st, and 2nd derivatives of right and left segments are equal. The 2nd derivative in the ending points equals zero.
|
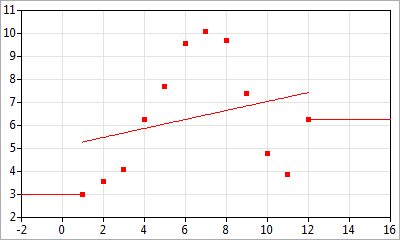
| Approximation |
The resulting function is a polynomial of Order you specify in the edit box on the right, formed in order the sum of the root-mean-square error in the points is minimal.
|

The feasible area of a table function is the function’s range, if the function is interpolated; or it is the defined set of points only, if no interpolation is set. You should define what should happen if a table function argument lies out of feasible area. Supported behavior types are the following:
- Error — If argument lies out of feasible area, runtime error is raised and a message box reporting about the error is displayed.
- Nearest — The function is extrapolated by using the nearest valid argument, i.e. for all arguments to the left (right) of the range, the function takes the value the function has in the leftmost (rightmost) point.
- Repeating — The function is extrapolated by repeating, i.e. it is made periodic with the function range as a period.
- Custom — If argument lies out of feasible area, table function returns a custom value, defined in the Value edit box below this option.
- Extrapolate — The function is extrapolated outside the range in accordance to the interpolation type.
To define the function behavior in infeasible area
- Select the table function icon in the graphical editor or in the Projects view.
- In the Properties view, choose the corresponding function behavior type from the Out of range drop-down list.
-
How can we improve this article?
-