

Although the flowchart is animated, you may want to see the actual bank department layout animated. That is also possible! For each model you can create an animation to visually represent your model. You can create any animation you want. Now we will draw the layout consisting of the ATM and a queue. Then we will animate clients standing in the queue and using the ATM. We also want to visualize the current status of the ATM.
Now we will draw the layout of our bank. You draw the layout on the same diagram where you draw a flowchart. However, if you have existing image of the layout, you can simply import this picture as the bank layout instead of drawing it by yourself.
Set up space markup for the ATM
-
Draw the ATM as a point node. First, open the
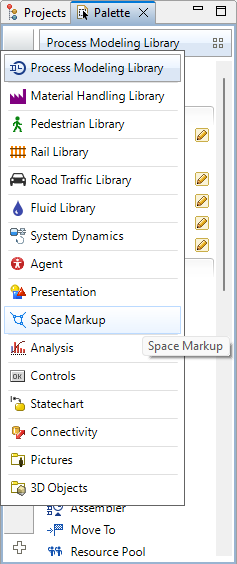
 Space Markup palette in the
 Palette view. To open a palette, just click on the corresponding icon in the vertical ribbon docked to the left part of the palette. While you are not accustomed to the palette icons, you may hover the mouse over the ribbon and wait for the popup window to appear. It will show you the names of all palettes.
-
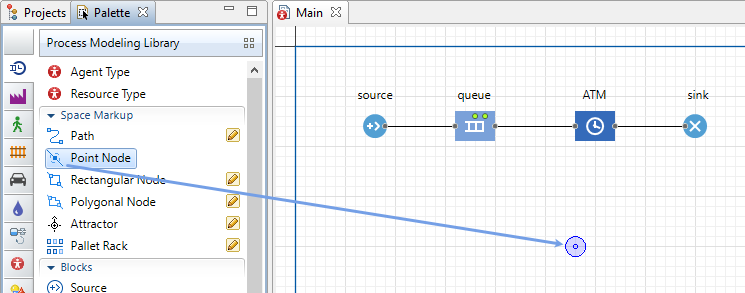
Drag the
 Point Node element into the graphical editor and place it under the flowchart.
-
Select the point node in the graphical editor to open its
 Properties view.
- Switch the Color property to the dynamic value editor by clicking the
 icon which will turn into
  allowing you to insert the Java expression in the field right next to it.

-
Enter the expression that will allow to change the color of the shape at runtime in the Color property:
ATM.size() > 0 ? red : green ATM here is the name of the
 Delay block we created. The expression determines the point node color at run time. The size() function returns the number of agents currently being processed. The color will be red, if a customer is being served at the moment, and green otherwise.
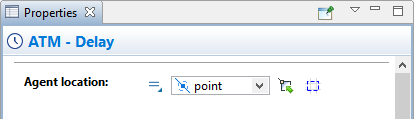
- Click the ATM block in the flowchart to open its properties.
-
In the Agent location option select the point node that you have drawn previously. You can either click the down arrow and select the point node from the list of appropriate space markup elements, or you can click the button, located on the right, to select this space markup shape from the graphical editor (the rest of the elements in the editor will be greyed out).
Set up space markup for the queue
-
Draw the queue as a path. First, open the
Space Markup palette in the
Palette view.
-
Double-click the
 Path element in the palette. A pencil icon will appear next to it, which means that you have switched to the drawing mode.
-
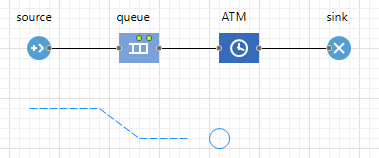
Click in the graphical editor to put the first point of the path. Do more clicks to add turning points. Finish drawing with a double-click.
-
Click the queue block in the flowchart and go to its
Properties view.
-
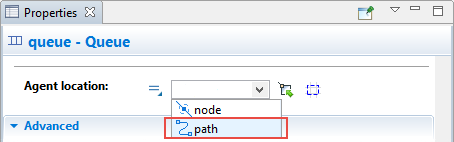
In the Agent location option select the path you have drawn previously. You can either click the down arrow and select the path from the list of appropriate elements, or you can click the button, located on the right, to select this space markup shape from the graphical editor (the rest of the elements in the editor will be greyed out).
Now you can run the model and observe its behavior. If you want to speed up the simulation significantly, switch to virtual time mode by clicking the  Run as fast as possible (virtual time mode) control. Switching to virtual time mode allows you to view simulation run at its maximum speed. Therefore, you can simulate a long period of time.
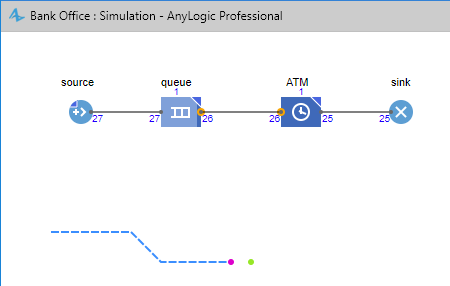
In the figure below you can see how the agents, represented by colored circles, are queuing in line and standing at the ATM.
Both of the elements we have drawn by default are shown in 2D and 3D. You can check this property in the Advanced section of their properties view. Now we want to create 3D animation for our model.
First of all you should add 3D window on the diagram of your agent type.
 3D Window plays the role of a placeholder for 3D animation. It defines the area on the presentation diagram where 3D animation will be shown at runtime.
Add 3D window
-
Drag the
3D Window element from the 3D section of the
 Presentation palette to the graphical editor.
-
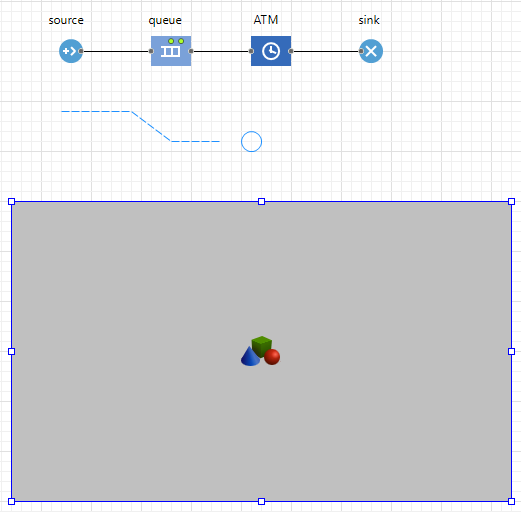
The grey area will appear on the screen. Locate it where you want your 3D presentation to be shown at the model runtime:
Now you can run your model and observe simple 3D animation.
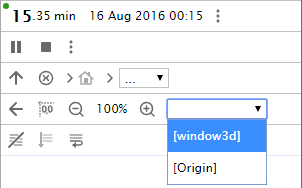
When you create a 3D window, AnyLogic adds a view area that allows you to easily navigate to the 3D view at runtime. To switch to this 3D view while the model is running, open the developer panel by clicking the Developer panel  control in the right corner of the control panel. In the developer panel, expand the
  select view area to navigate list and select [window3d] from the list.
You can navigate through the 3D scene using the commands described below:
| In order to | Use the mouse as described here |
|---|---|
| Move the scene | 1. Press the left mouse button in the 3D view and hold the mouse button pressed. 2. Move the mouse in the required direction. |
| Rotate the scene | 1. Press Alt key (macOS: Option key) and hold it pressed. 2. Click in the 3D scene window while holding Alt and the left mouse button down. 3. Move the mouse in the required rotation direction. |
| Zoom in/out the scene | 1. Scroll the mouse wheel in the 3D window away from / towards you. |
Now we want to add a customer figure. By default the customers are drawn as colored dots and shown as colored cylinders in 3D animation. We want to create our custom type of client and animate it in 3D. We will create a new agent type for this purpose.
Create a new agent type
-
Open the
 Process Modeling Library in the
Palette view.
Process Modeling Library in the
Palette view.
-
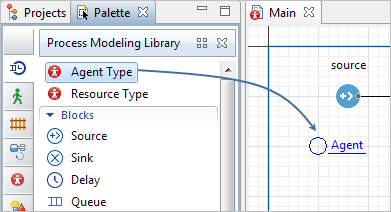
Drag the
 Agent type element into the graphical editor.
-
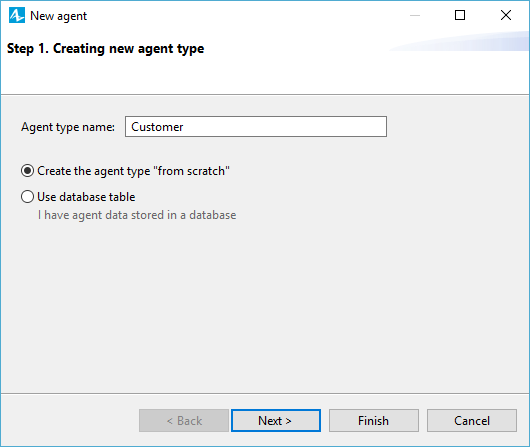
The New agent wizard will open on the Creating new agent type step. Enter Customer as the Agent type name, and leave the Create the agent type "from scratch" selected. Press Next.
-
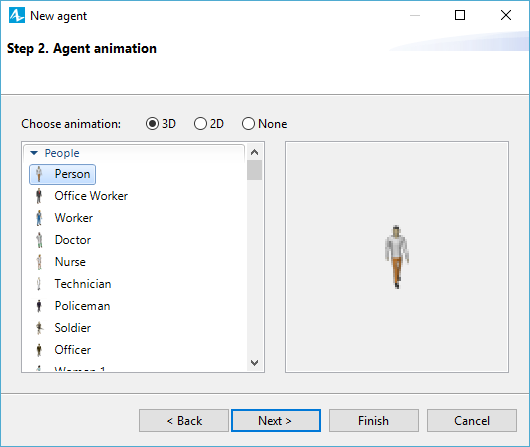
In the next step select 3D as the animation type and select Person from the list of the 3D figures.
-
Click Finish. The new
Customer diagram will open. You can find the Person 3D figure in the axis origin. Switch back to the
Main diagram.
Configure flowchart to use the new type
-
On the
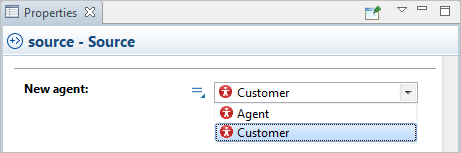
Main diagram, select the source block in the graphical editor.
-
Open the Agent section of the
Properties view and choose
Customer from the New agent drop-down list.
-
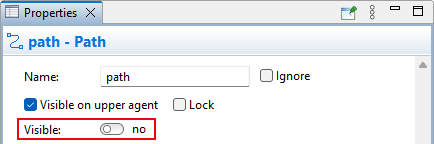
Go to the
Properties view of the node element and set Visible control to no. This way the markup shape will be invisible during animation on model runtime.

-
In the same manner make the path element invisible at runtime too.
-
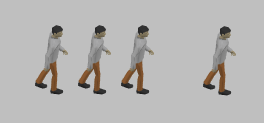
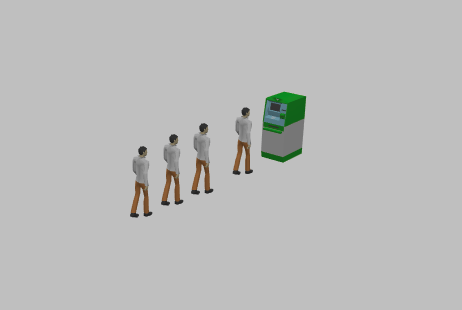
Run the model and switch to 3D view to see our customers moving in the queue.
Add an ATM figure
-
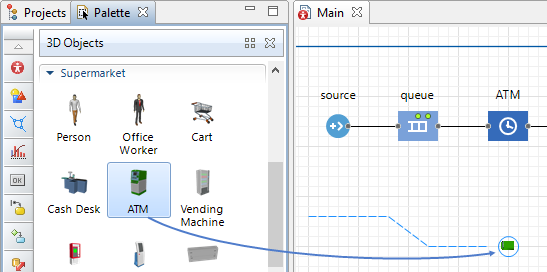
Open the
 3D Objects palette in the
Palette view.
3D Objects palette in the
Palette view.
-
Drag the ATM 3D figure from the Supermarket section of this palette onto the node in the graphical editor. In the displayed Auto scale 3D object dialog box click the Yes button.
- If you run the model now and check 3D animation in window3D mode, you will notice that our ATM does not face the customers' flow and we need to rotate it.
-
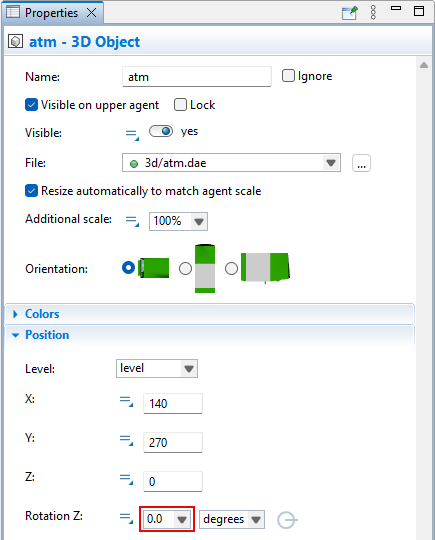
Select the atm 3D object in the graphical editor and open the section Position in its
Properties view.
-
Choose 0 degrees from the drop-down list of the Rotation Z option.
-
Run the model to double-check that the ATM is facing the customers now.
-
How can we improve this article?
-