

If you are creating a new agent population, and have attribute values for all agents stored in a database, you can easily create a population based on the existing data.
Assume you have the following Excel spreadsheet, and you want to create a population of five cities:
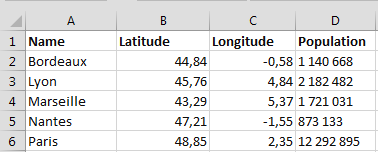
Data in Excel spreadsheet should meet the following formatting requirement:
- Each column with data should have its name defined in the first row. This name will be used as the name of the agent’s attribute (parameter)
The following video demonstrates how to create an agent population and provide agents with attributes that are read from the MS Excel spreadsheet:
The following video shows how to read agents’ addresses/coordinates from the database and locate agents in the given points on the GIS map:
To create a population of agents based on the existing data
-
Drag the Agent
 element from the Agent palette on the diagram where you want to
create the population (usually — Main). The New agent wizard will open.
element from the Agent palette on the diagram where you want to
create the population (usually — Main). The New agent wizard will open.
-
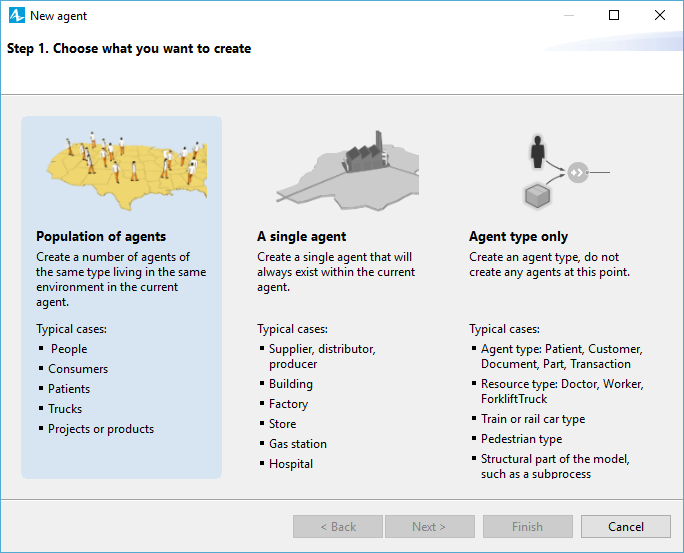
First, choose, whether you want to create the agent population, one
single agent, or you just define the agent pattern (to create agents
later e.g. with the
Source
flowchart block). We want to create an agent population, so click
Population of agents. The wizard will take you to the next step.
- If you already have some agent types defined in the model, on the next page of the wizard choose I want to create a new agent type, and click Next.
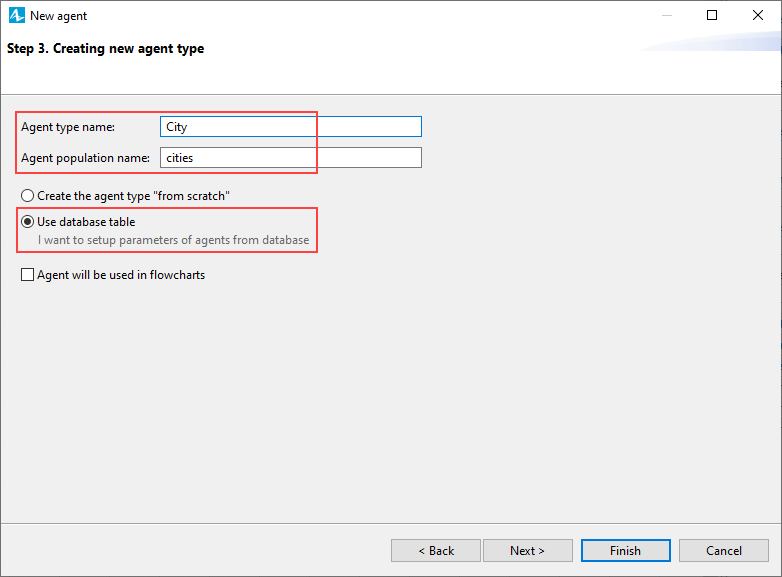
- You will see the next wizard page. Since we want to read the agent attributes from the database, choose the option Use database table.
- On the same page of the wizard, specify Agent type name (in our case it will be City). You will see the Agent population name automatically changed to cities.
-
If you plan to use the agents of this type in the flowcharts (e.g. in
the Process Modeling Library flowchart), select the checkbox
Agent will be used in flowcharts and then choose the role for
this agent (Agent, Resource unit, etc.) from the drop-down
list on the right. Click Next.
- If you have already imported the database table into the built-in AnyLogic database, select Use existing table and choose the table name in the list on the right. Otherwise, if you have not imported data yet, and have them stored in an external database, or a spreadsheet (it is our case), select the option Import table from external source.
- In the left pane, specify the database Type (in our case it is Excel/Access, other option is Other Database).
-
Using the controls below, specify the database location. If an Excel or
an Access file is used as the data source for the database, you can use
the
 button
to switch between the
absolute and relative file path.
button
to switch between the
absolute and relative file path.
In the right pane, you will see the list of database tables (if not, click the Show list of tables button). In this list, select the table that contains the data for the agent population, and click Next.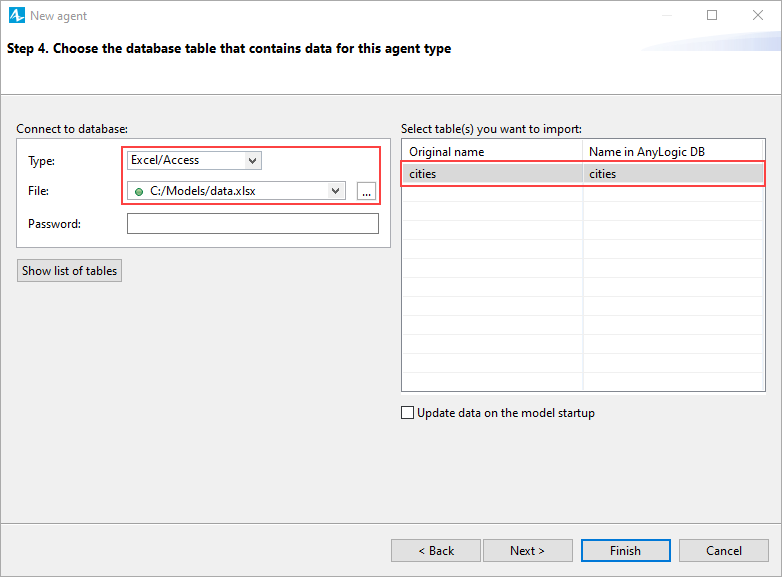
-
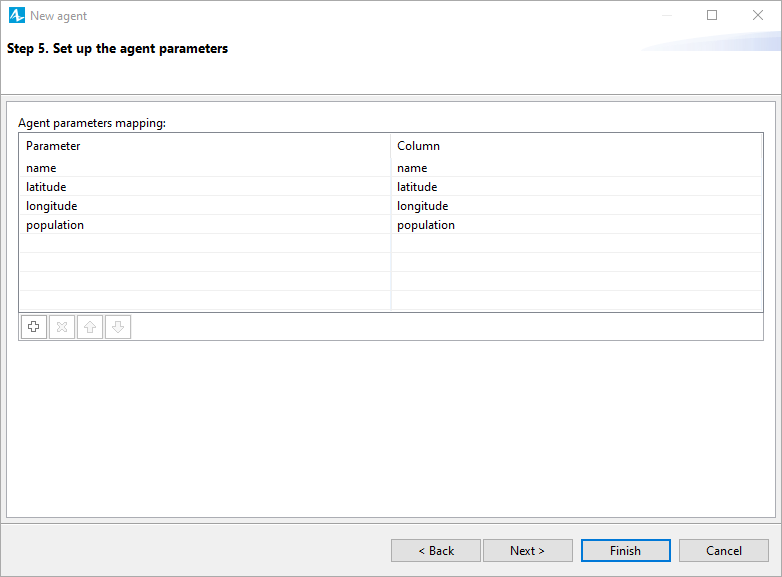
On the next page of the wizard, you can set up the parameters of the new
agent type. In the Agent parameters mapping table, you will see
the list of parameters that will be created. By default AnyLogic
proposes to create one parameter for each database table column that
contains data. You can change the name of the parameter in the
Parameter column. If you do not need some parameter to be
created, select the corresponding row in the table, and click the
 Remove button below. Click Next when finished.
-
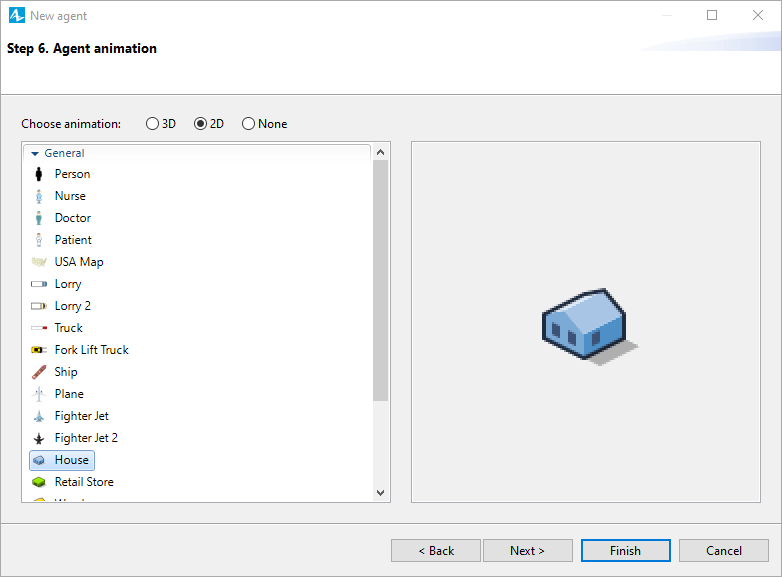
On the next page of the wizard, specify the animation for the agent. If
you want the agents to be animated both in 2D and 3D, choose
3D and select the animation shape from the list below. If you
need the shape that is shown only in 2D, choose 2D and select the
shape from the list. If no shapes satisfy your needs, just choose
None. You can draw animation on the agent type diagram later on.
Finished with choosing the animation, click Finish to end the process.
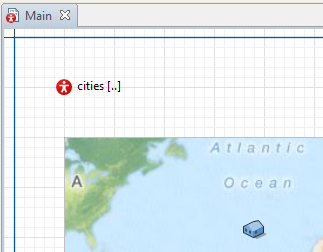
When finished, you will see the
![]() element
on the Main diagram — it is
an agent population. The population contains the number of agents
equal to the number of records in the database table we’ve used. In
the Projects tree, you can see the created agent type (
element
on the Main diagram — it is
an agent population. The population contains the number of agents
equal to the number of records in the database table we’ve used. In
the Projects tree, you can see the created agent type (![]() City).
City).
We want to place our agents in the GIS space at the points with coordinates that we read from the database. This requires us to add a GIS map on the Main diagram.
To add a GIS map
-
Drag the
 GIS Map element from the GIS section of the
  Space Markup palette into the graphical editor.
GIS Map element from the GIS section of the Space Markup palette into the graphical editor.
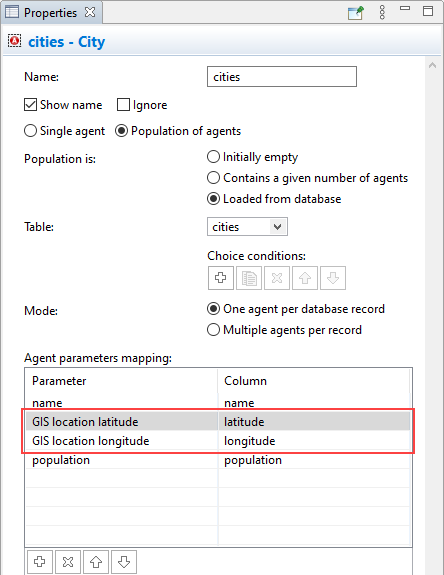
Now let’s show you how to locate our agents at the coordinates read
from the database. Click the
![]() cities element on the
Main diagram. In the Properties, open
the Agent parameters mapping table, click in the latitude cell in the name column, and select the
GIS location latitude option from the drop-down list. In the longitude cell, select the
GIS location longitude option.
cities element on the
Main diagram. In the Properties, open
the Agent parameters mapping table, click in the latitude cell in the name column, and select the
GIS location latitude option from the drop-down list. In the longitude cell, select the
GIS location longitude option.
Here we refer to the individual agent in a population by the keyword self.
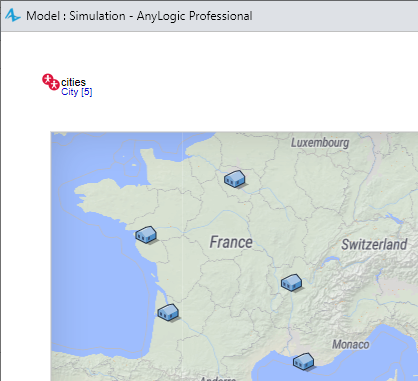
Now if you run the model, you will see that the agents are placed according to the coordinates we have read from the database:
Now you can develop the City agent logic further. Open the agent’s diagram by double-clicking City item in the Projects view, and add any other elements you need on the diagram.
-
How can we improve this article?
-