

Services in pedestrian flow models define a group of similar physical service objects (turnstiles, ticket vending machines, security checkpoints, check-in counters, etc.)
There are two types of space markup shapes you can use to draw services in your pedestrian model:
 Service with Area is used for defining service(s) with electronic queue (like in bank office, information office on the railway station, etc.). Pedestrians do not stand in a queue line, but wait for their turn in the neighboring area. The area is modeled by a polygonal node.
 Service with Lines is used for defining service(s) with queue(s) where pedestrians wait until the service becomes available in a queue line. Two types of queues are supported: usual queue lines, and "serpentine" queue typically used in airport check-in areas.
First, you draw the service in the graphical diagram, then add the PedService Pedestrian Library block to the flowchart and configure it by tuning its parameters.
To draw a service with lines
- Drag the Service with Lines element from the Space Markup section of the
 Pedestrian Library palette to the graphical diagram.
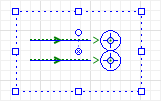
- Locate the service points in the graphical editor. When working with markup shapes, the first click selects all shapes of this markup element (in our case — two queue lines and two service points). To select just one particular shape, make one more click on it. After that you can edit this particular shape and your changes won’t affect other markup shapes. The third click on the same shape selects all shapes of this markup element.
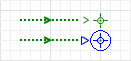
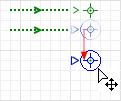
- The service points are usually located with the same offset. If needed, place these two service points so that they match their locations on the drawing before you change the number of services. Then the service points that you add later will be located with this custom offset. To move a service point, select it and drag without releasing the left mouse button.
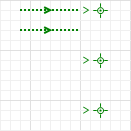
- You can now change the number of service points. Open the service properties page and change the Number of services value. Let’s set it to 3. You will see that a new service point appeared in the graphical diagram:
To draw a service with a "serpentine" queue
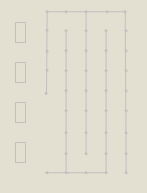
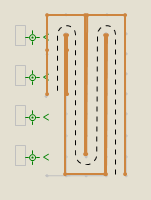
Let’s demonstrate how to draw four check in counters with a serpentine queue. Here is our layout, you can see four placeholders for check-in counters on the left side:
-
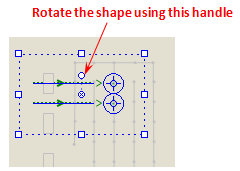
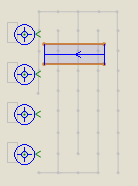
Drag the Service with Lines element from the Space Markup section of the Pedestrian Library palette into the graphical diagram. You will see the space markup shape consisting of two service points and two queue lines. In our example, we need to rotate the shape because the service points should be on the left side.
-
Now we will place the service points near the placeholders. Service point defines the place where the passenger will wait while receiving the service. Since placeholders define the places for the check-in counters, you should place service points not inside the placeholders, but close to them.
Place the upper service point near the upper placeholder, and then move the lower service point to the second placeholder. You may notice that when you click the services, you select all the shapes composing this complex element. To select just one particular shape of a complex space markup element (in our case - a service point), make one more click on it.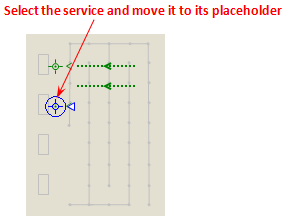
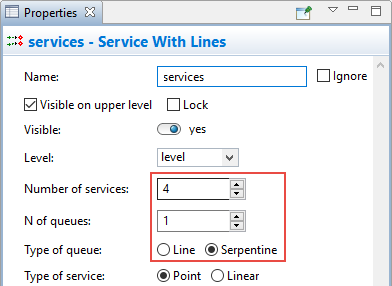
- Open the properties of the Service with Lines element. The easiest way to open the properties of the complex space markup shape is to click somewhere in the graphical editor, and then click the services shape.
-
Set Number of services to 4, N of queues to 1, and set Type of queue: Serpentine.
-
After configuring the properties, the shape should look as shown below. You can see that the service points are located with the same offset. That is why we first adjusted two of them to the placeholders (and defined the distance between the neighboring service points), and only then increased the number of services.
-
Now we will change the shape of the "serpentine" queue. We want it to match the borders in the layout. When we need to finely adjust the shape in the graphical editor, we turn the grid alignment off, so press off the Enable/Disable Grid
 toolbar button.
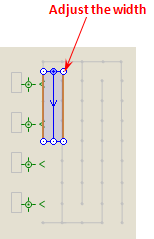
- Select the queue shape with a click. Move the queue starting point (the one that is indicated with a white circle) to the center (where the queue starts).
-
If needed, adjust the width of the queue shape by dragging the handle on the shape corner.
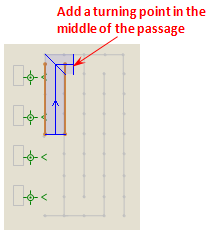
- We have placed the first segment of the queue shape as we need, and we can continue drawing the queue by adding more segments. Right-click the queue shape and choose Add Points from the context menu.
-
Add one more point by clicking at the place where the queue will turn. Please note that you should click exactly in the middle of the passage, as shown in the figure below:
-
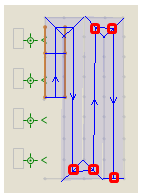
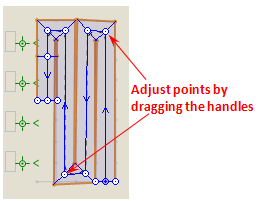
Continue drawing the serpentine queue by adding more turning points in the places indicated on the figure below. Add the final point with a double-click.
-
If some points are not aligned, adjust them by dragging the point handles with the mouse.
-
Finally you will get the queue of the required shape:
- To define how passengers check-in at the drawn counters, insert the PedService Pedestrian Library block in your flowchart, configure its parameters, and choose the name of the just drawn Service with Lines in the Services parameter of this PedService block.
- General
-
Name — The name of the service. The name is used to identify and access the service shape from code.
Ignore — If selected, the service shape is excluded from the model.
Visible on upper agent — If selected, the service shape is also visible on the upper agent where this agent lives.
Lock — If selected, the service shape is locked. Locked shapes do not react to mouse clicks — it is impossible to select them in the graphical editor until you unlock them.
Visible — Here you specify whether the shape is visible on the animation at the model runtime, or not. Using the control, choose yes or no.
Level — The level to which this service belongs.
Number of services — Here you can define the number of service points.
N of queues — Here you can define the number of queues leading to the service points..
Type of queue — Type of the queue: usual queue Line, or Serpentine queue (also named “zigzag” queue).
Type of service — Type of the service point. Use Linear for services where pedestrians should move along the service shape, passing begin and end points of the line. Use Point for services, where pedestrians should stand at any point of the line.
Bidirectional — [Enabled if the Type of service is Linear] If this option is selected, pedestrians can pass services in both directions.
N of reverse queues — [Enabled if the service is Bidirectional] Here you can define the number of reverse queues leading to the service points. Pedestrians can pass services in any direction.
Wait for exit — [Enabled if the Type of service is Linear] If this checkbox is selected, the service would not start servicing another pedestrian if some pedestrian is being serviced currently and has not reached the end point of service’s queue yet. For example, turnstiles do not have such restriction, while security check service does.
Serve pedestrians from — Defines the queue from which the service will serve pedestrians. When the service becomes vacant, it chooses the queue anew according to the selected option. The following alternative options define the queue to be selected:
Longest queue — the queue containing the maximum number of pedestrians.
Closest queue (strict) — the queue that is closest to the service, no matter whether it is empty or not.
Closest not empty queue — the non-empty queue that is closest to the service.
Next queue (round robin) — the queues are selected sequentially in circular order.
Priority queue — the queue with the highest priority is selected (according to the expression provided in the Queue priority field below) Other queue — the queue is returned by the expression specified in the Queue field below.Queue priority — [Visible if Serve pedestrians from is set to Priority queue] Here you can enter Java expression that returns the queue priority. The greater value corresponds to the higher priority. The expression is dynamically re-evaluated for each non-empty queue. Based on the results of recalculations the queue with the highest priority will be chosen. You can refer to the service’s queues in the expression using the local variable queue.
Queue — [Visible if Serve pedestrians from is set to Other] Here you can enter Java expression that returns the selected queue. Typically you place the call of your custom Java function here. The service point that has just become vacant and is currently selecting the queue is available here as serviceUnit.
- Grouping
-
This whole section is accessible only if Type of service is Point.
Waiting area for groups — Selecting this option you will create the area that will act as the waiting area for pedestrian group members. Inside this area the members of pedestrian group will wait while the leader of their group is serviced at this service (you should do this only if the Group behavior in service is Only one group member is serviced, others wait in a waiting area). The waiting area is defined by a polygonal node.
Group behavior – When passing through a service, a group of pedestrians may behave differently. You can choose one of three alternative behavior modes (All group members are serviced individually, Only one group member is serviced, others wait in a queue, or Only one group member is serviced, others wait in a waiting area).
Since the behavior may depend on the role of the particular group (guided group of tourists, family, group of friends), you may want to define it once for the group to avoid setting several times in different service shapes. In this case you define the behavior mode in the object creating this group (it can be PedSource, PedEnter, or PedGroupAssemble).If this particular group of services should follow the same rules you have defined for the group, just choose here Depends on the settings of each incoming group.
If this block defines the service where the pedestrian groups behave in a different way, choose here The same for all groups and define this behavior using the parameter below.
The behavior — Here you can choose how groups of pedestrians behave while passing through this service. There are three alternative behaviors:
- All group members are serviced individually — Each member of the group should be serviced individually. The example: turnstiles.
- Only one member is serviced, others wait in a queue — The example: a family buying cinema tickets at the counter. All the family members wait in a queue to choose the seats together, but only one of them — the head of the family pays and gets serviced.
- Only one member is serviced, others wait in a waiting area — The example: a tourist group buying museum tickets. The tourists do not wait in the queue, they just wait for their tour guide to buy the tickets for the whole group. To draw the waiting area for this case, select the Waiting area for groups option above and adjust the created polygonal node in the graphical editor.
- Appearance
-
Service color — Color of service shape(s).
Queue color — Color of queue shape(s).
Reverse queue color – [Accessible if Bidirectional is enabled] Color of reverse queue shape(s).
- Advanced
-
Show in — Here you can choose whether you want the shape to be shown both in 2D and 3D animation, or in 2D only, or in 3D only.
Show name — If selected, the shape’s name is displayed in the graphical editor.
When passing through services with lines, a group of pedestrians may behave differently.
The behaviors are:
- All group members are serviced individually — Each member of the group should be serviced individually. The example of such a service: turnstiles.
- Only one group member is serviced, others wait in queue — The example: a family buying cinema tickets at the counter. All the family members wait in a queue to choose the seats together, but only one of them — the head of the family pays and gets serviced.
- Only one group member is serviced, others wait in a waiting area — The example: a tourist group buying museum tickets. The tourists do not wait in the queue, they just wait for their tour guide to buy the tickets for the whole group. To draw the waiting area for this case, select the Waiting area for groups option above and adjust the created polygonal node in the graphical editor.
You can choose one of three alternative behavior modes in the flowchart block that creates pedestrian groups (it can be PedSource, PedEnter, or PedGroupAssemble), and even change the group servicing settings in the properties of some specific service with lines (Grouping property section).
Demo model: Group Behavior in Services Open the model page in AnyLogic Cloud. There you can run the model or download it (by clicking Model source files). Demo model: Group Behavior in ServicesOpen the model in your AnyLogic desktop installation.You can obtain the properties of the service with lines at model runtime using the API.
- Service
-
Function Description boolean isBidirectional() Returns true if the service with lines is bidirectional, that is, pedestrians can pass services in both directions. Returns false otherwise. boolean isWaitForExit() Returns true if the service with lines is set to wait for exit, that is, the service cannot start servicing other pedestrians if a pedestrian is currently being serviced. Returns false otherwise. - Queue lines
-
Function Description List getQueues() Returns the list of queue lines belonging to the current service with lines. List getReverseQueues() Returns the list of reverse queue lines belonging to the current service with lines. Color getQueueColor() Returns the color of the queue elements. Color getReverseQueueColor() Returns the color of the reverse queue elements. setQueueColor(Color color) Sets the color of the queue elements. setReverseQueueColor(Color color) Sets the color of the reverse queue elements. - Waiting area
-
Function Description AreaNode getGroupWaitingArea() Returns the area markup element (if any) associated with the current service with lines. - Level
-
Function Description Level getLevel() Returns the level on which this service is located. - Removal
-
Function Description void remove() Removes the service with line from the presentation. If this element is not a part of presentation, the function does nothing. Note, that removal from the presentation does not necessarily mean removing from the model logic, since logical networks and routes may have been created before the removal and survive it.
-
How can we improve this article?
-