

System Dynamics element.
Link is used to define a dependency between elements of a stock and flow diagram. There are two types of dependencies:
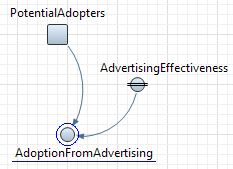
- Some element (stock, flow, dynamic variable or parameter) is mentioned in a formula of a flow or a dynamic variable. This type of a link is drawn with a solid line:
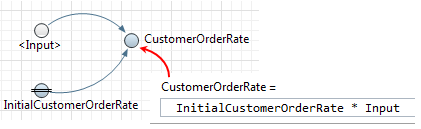
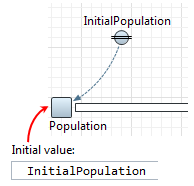
- Some element is mentioned in the initial value of the stock. This type of link is drawn with a dotted line:
AnyLogic does not create links automatically but enforces the user to draw links explicitly in the graphical editor (however, AnyLogic also supports quick fix mechanism for missing links, see below).
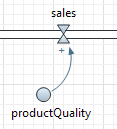
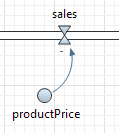
Links may have positive or negative polarity:
-
Positive causal link means that the two nodes change in the same direction, i.e. if the node in which the link starts decreases, the other node also decreases. Similarly, if the node in which the link starts increases, the other node increases.
We assume that all other nodes keep the same values.
-
Negative causal link means that the two nodes change in opposite directions, i.e. if the node in which the link starts increases, then the other node decreases, and vice versa.
We assume that all other nodes keep the same values.
The relationships between variables, represented by links, can be labeled as positive or negative. Polarity is usually indicated with a /- sign at the link arrowhead. It shows how the dependent variable changes when the independent variable changes.
To create a link from one SD element to another
- Double-click the
 Link element in the
  System Dynamics palette. The icon of the element should turn into
  . It means that the drawing mode is activated and now you can draw a link in the graphical editor.
 - Start drawing the link in the graphical editor. Click the element that is mentioned in the equation.
- Finally, click the dependent element (i.e. the element, in whose equation the dependency is defined).
- When finished, you will see the link in the graphical editor. It will be selected and in case you have successfully drawn it, its end points should be indicated with little green circles (see case c in the figure below). Otherwise, if the link is selected but there is a white circle on some its end (case b), it means that this particular end point was not connected correctly. To fix and establish the valid connection, please drag this end point onto the variable you want to connect.
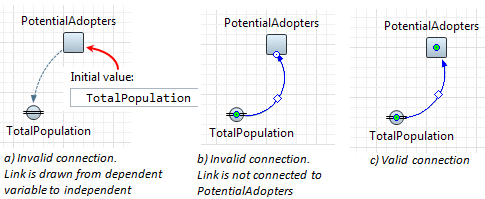 It is important to draw the link in the right direction — from the independent variable to dependent (the figure a above demonstrates invalid connection case).
 - Go to the Properties view to set up properties of the link. Choose the symbol that will indicate the link polarity from the Polarity group of options. You can choose from standard + and -, s (stands for same relationship), or o (opposite relationship). Moreover, you can specify your own symbol in the edit box to the right.
- If needed, change the line Color and Line width.
- Optionally, adjust the link appearance.
- General
Polarity — Here you can choose the symbol that will be shown near the link and will denote its polarity. It can be + (means positive polarity), - (negative), s (stands for same relationship), or o (opposite relationship). Moreover, you can specify any other symbol in the edit box to the right.
Color — Here you can change the color of the link.
Line width — Here you can set the width of the link.
Delay — If selected, the double dash will be shown striking the link to indicate that this link involves delays in causal loop diagrams:

You can customize the link appearance, namely you can change link color and edit link bend angle.
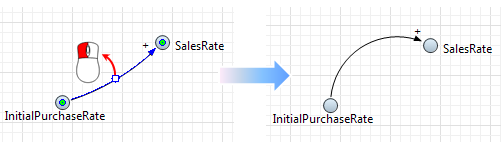
To modify the bend angle of the link
- Select the link in the graphical editor. You will see the handle drawn in the middle of the link.
- Drag this handle aside. You will see that the bend angle changes in accordance with your action.
To change the color of the dependency
- Select the link in the graphical editor with a mouse click.
- In the Properties view, choose the color using the Color control.
AnyLogic provides a quick fix mechanism enabling you to add missing links in a handy way.
To add all missing links at once
- If an equation in the formula or initial value of some system dynamics element mentions some variables, and they are not connected with links, AnyLogic will display errors in the Problems view:
.png)
- Find the element that contains the equation in the graphical editor and right-click it.
- In the context menu, you will find the option Fix Dependency Links, expand it and select Create Missing Links to add the links that are expected to be there.

- All necessary links will be drawn right away. The conflicts will be resolved, and the Problems view will clear.
- If there are redundant links, you can remove them using the option Remove Unused Links from the context menu.
To add a missing link one by one
- Let’s assume that equation in the formula or initial value of some system dynamics element, say variableA, mentions some variableB that is not connected with a link with variableA.
- Go to the Properties view of the variable that throws error indicator (variableA) and click in the equation field. You will see the error indicator shown to the left of the formula.
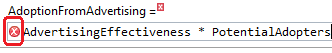
- Click the error indicator. You will see the context menu containing item(s) Create missing link for [variable_name].
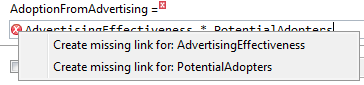
- Choosing an item from the list you create the corresponding missing link. You can easily create all missing links one by one in such the way:
If you have a complex system dynamics model, and there are too many links between the elements of your stock-and-flow diagram, you can hide the links using the layers feature implemented in the graphical editor.
-
How can we improve this article?
-