A breakpoint is a debugging tool that stops the execution of a model at a specific point, allowing you to inspect the state of the model, including agent properties, variables, and interactions. It is typically associated with a specific line of code in the model. You can add breakpoints in:
- property code fields,
- the Java editor,
- the Breakpoints view.
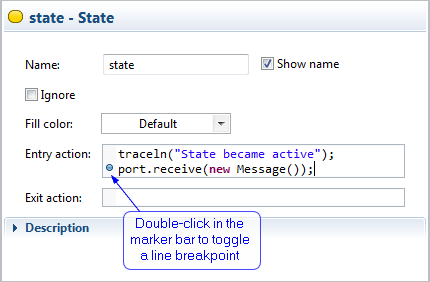
When enabled, the breakpoints are displayed as a  blue circle to the left of the code field (in the property editor or Java editor) . You can also view and manage them in the Breakpoints view.
Breakpoints can be set on any executable line of a model code.
To add a breakpoint
-
In the Java editor, directly to the left of the line where you want to add the breakpoint, right-click (macOS: Ctrl + click) the marker bar (vertical ruler) and select Toggle Breakpoint from the context menu, or
Double-click on the marker bar.
In the Properties view, the same actions are applicable, but first you must place the cursor in the corresponding code field.
- A new breakpoint marker appears on the marker bar. The new breakpoint also appears in the Breakpoints view list.
While the breakpoint is enabled, the execution of the model thread is halted before that line of code is executed. The debugger selects the suspended thread and displays the stack frames of the thread. The line where the breakpoint was set is highlighted in the code editor.
To disable an added breakpoint in the editor
A disabled breakpoint does not cause the model to suspend. Disabled breakpoints are indicated by a  white circle.
-
In the Java editor, directly to the left of the line where you want to add the breakpoint, right-click (macOS: Ctrl + click) the marker bar (vertical ruler) and select Disable Breakpoint from the context menu.
In the Properties view, the same actions are applicable, but first you must place the cursor in the corresponding code field.
You can remove breakpoints when you no longer need them.
To remove a breakpoint
-
In the Properties view or in the code editor, directly to the left of the line where you want to remove the breakpoint, right-click (macOS: Ctrl + click) the marker bar (vertical ruler) and select Toggle Breakpoint from the context menu, or
Double-click the breakpoint icon directly to remove the breakpoint.
This will remove the breakpoint from the workspace.
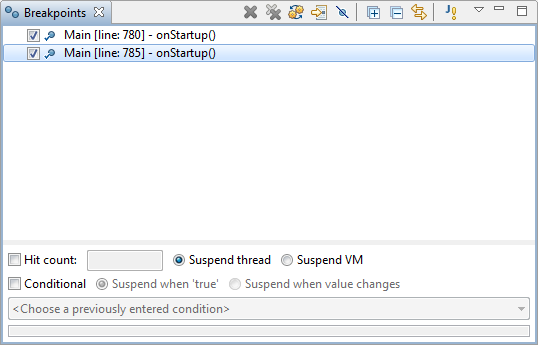
The Breakpoints view lists all the breakpoints currently set in your workspace, allowing you to view and manage them..
To toggle the Breakpoints view
-
Select View >
 Breakpoints from the main menu of AnyLogic.
 The Breakpoints view
When in this view, you can double-click a breakpoint to display its location in the graphical or Java editor (if applicable).
The Breakpoints view provides a set of toolbar buttons that allow you to work with the breakpoints listed in the view:
| Command | Action |
|---|---|
 Remove Breakpoint Remove Breakpoint
|
Removes the selected breakpoint. |
 Remove All Remove All
|
Removes all breakpoints from the view. |
 Show Supported Breakpoints Show Supported Breakpoints
|
Toggles the view to show all breakpoints or only breakpoints supported by current target. |
 Go to File for Breakpoint Go to File for Breakpoint
|
Opens the Java editor and selects there the line that corresponds to the selected breakpoint. In case the breakpoint was originally set in the Java class or interface code, that class or interface code is displayed in the Java editor and the corresponding line is selected. If the breakpoint was set in the properties of a model element, the code generated for the agent — owner of this element — is displayed in the editor and the particular line containing this breakpoint is selected. |
 Skip All Skip All
|
Sets all breakpoints to be skipped. |
 Expand All Expand All
|
Expands all items in the view. |
 Collapse All Collapse All
|
Collapses all items in the view. |
 Link with Debug View Link with Debug View
|
Toggles the view contents to be synchronized with the Debug view. |
 Add Java Exception Breakpoint Add Java Exception Breakpoint
|
Opens the Add Java Exception Breakpoint dialog, where you can create exception breakpoints. |
There are several types of breakpoints in AnyLogic, which behave slightly differently in terms of execution and model logic.
- Java line breakpoint — A breakpoint associated with the line of code in a custom function (usually within in a Java class).
- Property breakpoint — An extended Java line breakpoint that also contains information about its location. Used for breakpoints in property values.
- Java watchpoint — A Java class breakpoint used to monitor changes or attempts to access specific fields or variables within the class.
- Java exception — A breakpoint that is triggered by a specific Java exception. Can only be created in the Breakpoints view.
These are the most common types of breakpoints used in AnyLogic models. Other types you may encounter while working with AnyLogic are inherited from the development environment.
To open the breakpoint properties, right-click (macOS: Ctrl + click) the breakpoint in its location in the Java editor or in the Breakpoints view and select Breakpoint Properties from the context menu.
The properties are also visible in the Breakpoints view. Select the breakpoint and check the bottom of the view to see them.
- Common properties
-
These properties are available for all types of breakpoints.
Trigger point — Select to define this breakpoint as a trigger point. Other breakpoints will not be triggered until the trigger point is activated.
If there is more than one trigger point in the model, once one is activated, the others are ignored.Hit count — Specifies how many times the breakpoint should be triggered before the model is suspended. Must be an integer. For more information, see below.
Suspend policy — One of the following:
Suspend thread only suspends the thread with the running model when the breakpoint is triggered.
Suspend VM stops the Java virtual machine.Conditional — Select this to add a triggering condition:
Suspend when 'true' — The breakpoint will triggered when the specified condition is true.
This option allows you to use variables that are available in the context of the function where the breakpoint is called. For more information, see below.
Suspend when value changes — The breakpoint is triggered when the value of the specified condition changes.
- Java watchpoint
-
Access — The breakpoint is triggered when the model attempts to access the value (for example, read it).
Modification — The breakpoint is triggered when the value is modified.
- Java exception
-
Caught locations — Should be selected. In AnyLogic, the Java exception breakpoint will only be triggered if the exception is thrown and caught by a Java catch clause.
Uncaught locations — Does not work in the context of a running model, so should be ignored.
Subclasses of this exception — The breakpoint will be triggered for both the specified exception class as well as its subclasses. For example, if RuntimeException is selected and this option is enabled, ArithmeticException, ClassCastException and others will also cause the breakpoint to be triggered.
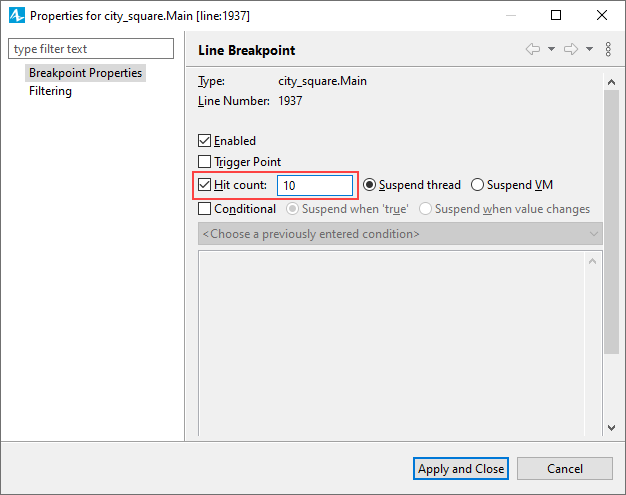
You can apply hit counts to breakpoints. When hit count is applied to a breakpoint, the breakpoint suspends the execution of a thread for the specified number of times it is hit, but never again until it is re-enabled or the hit count is changed or disabled. The breakpoint is then disabled until it is either re-enabled or its hit count is changed.
To set the hit count for a breakpoint
- In the Properties view, click into the line where the breakpoint is set.
- Press Ctrl + J (macOS: Cmd + J) to open the Java editor with the line of code corresponding to the one selected in the Properties.
- Right-click (macOS: Ctrl + click) the breakpoint for which you want to add a hit count in the marker bar (vertical ruler) and select Breakpoint Properties from the context menu.
- The Properties for… dialog appears.
- Select the Hit Count check box.
-
In the edit box to the right, type the number of times you want the breakpoint to be hit before execution is interrupted.

- Click OK to close the dialog and apply the changes.
An enabling condition can be applied to a breakpoint so that the breakpoint suspends the execution of a thread:
- when the enabling condition is true,
- when the enabling condition changes.
To set a condition on a breakpoint
- In the Properties view, click into the line where the breakpoint is set.
- Press Ctrl + J (macOS: Cmd + J) to open code editor. The Java editor opens with the line of code corresponding to the one selected in the Properties highlighted. Right-click (macOS: Ctrl + click) the breakpoint for which you want to add a hit count in the marker bar (vertical ruler) and select Breakpoint Properties from the context menu.
- The Properties for… dialog appears.
- In the properties dialog, select the Conditional check box.
- Enter the expression for the breakpoint condition in the field below.
-
Select one of the following:
-
If you want the breakpoint to stop each time the condition evaluates to true, select the Suspend when 'true' option. The specified condition must be a Boolean expression.
For example, if the condition is myElevator.nTransportedPeds() > 10;, the breakpoint will be triggered when the number of pedestrians transported by the myElevator elevator becomes greater than 10. -
If you want the breakpoint to stop only when the result of the condition changes, select the Suspend when value changes option.
For example, suppose the elevator starts its ascent from floor 1 to floor 10 and then returns. If the condition is myElevator.getCurrentLevel() > 5;, then the breakpoint will be triggered first time when the elevator passes the 5th floor (and the condition evaluates to true). Then, as the elevator descends, it will be triggered a second time when it reaches the 5th floor (and the condition will therefore evaluate to false).
-
If you want the breakpoint to stop each time the condition evaluates to true, select the Suspend when 'true' option. The specified condition must be a Boolean expression.
- Click OK to close the dialog and apply the changes. While the breakpoint is enabled, thread execution suspends before that line of code is executed if the breakpoint condition evaluates to true.
A conditional breakpoint has a question mark overlay on the breakpoint icon:  .
.
-
How can we improve this article?
-

