

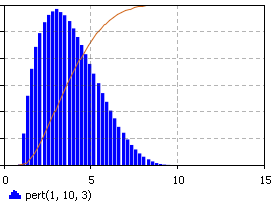
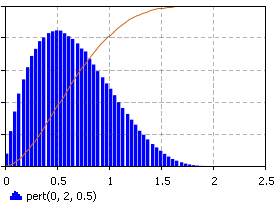
The PERT distribution is a continuous distribution bounded on both sides. Being an alternative distribution to the triangular, it has the same three inputs (minimum, most likely, and Maximum), but is a smooth curve that puts less emphasis on extreme values. The PERT distribution is often used in risk analysis applications, for example, in Monte Carlo simulations to assess cost and project duration risks.
- Description
- Generates a sample of the PERT distribution.
- Parameters
-
Name Type Description min double The minimum x value. max double The maximum x value. mode double The most likely x value. - Result
-
Type Description double The generated sample.
- Description
- Generates a sample of the PERT distribution using the specified random number generator.
- Parameters
-
Name Type Description min double The minimum x value. max double The maximum x value. mode double The most likely x value. r java.util.Random The random number generator. - Result
-
Type Description double The generated sample.
-
How can we improve this article?
-