Applies to AnyLogic Cloud 2.5.1. Last modified on January 14, 2025.
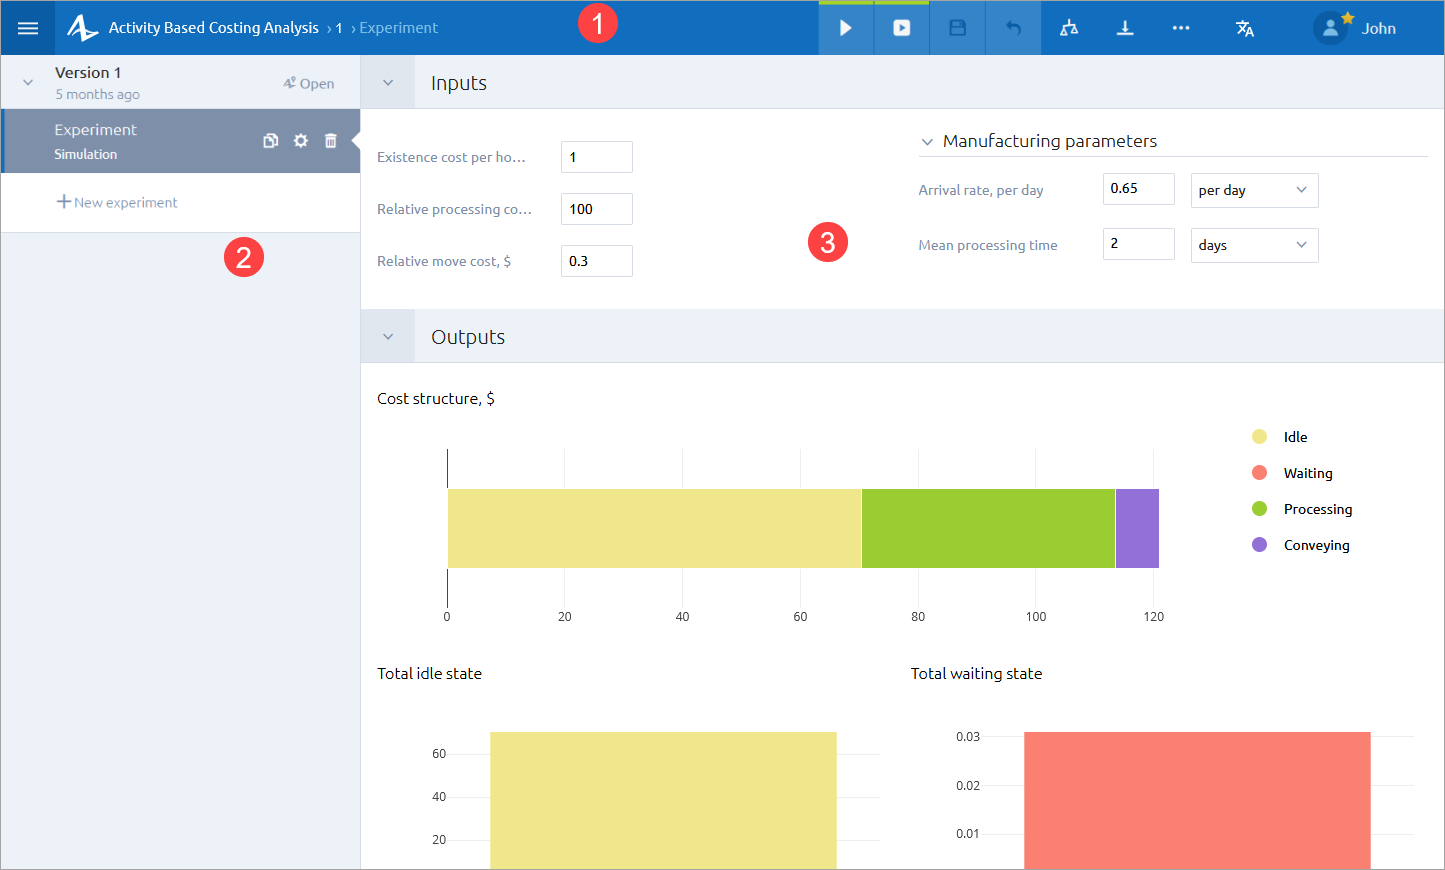
The experiment screen is your workspace for running experiments in AnyLogic Cloud and viewing the results of the run:

The experiment screen consists of the following areas:
- The experiment toolbar extends the main AnyLogic Cloud toolbar and contains buttons for performing basic experiment tasks in AnyLogic Cloud.
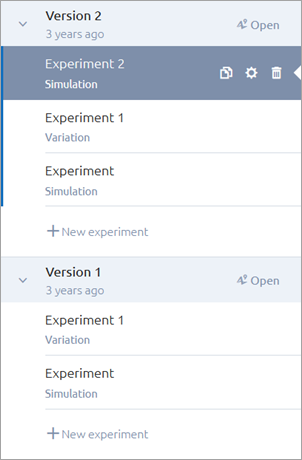
- The sidebar lists the existing model versions and the experiments created for each model version. Select an experiment in the sidebar to open it in the experiment screen.
- The experiment dashboard displays the parameters and the results of the experiment:
- The Inputs section: Displays the model version’s parameters and allows you to edit them.
- The Outputs section: Displays the outputs of the model version, if the experiment has already been run. The section is blurred if the experiment has not yet been run.
The experiment toolbar extends the main AnyLogic Cloud toolbar. It is displayed at the top of the experiment screen:

Use the experiment toolbar buttons to perform basic experiment tasks in AnyLogic Cloud. Hover the mouse pointer over a toolbar button to see its name.
|
|
Toggle the sidebar. |
|
|
Navigate to the AnyLogic Cloud title screen.
Private Cloud administrators can replace this image in the Customization tab of the administrator panel.
|
| [Model name] | Navigate to the model screen. |
| [Version name] | Navigate to the Versions tab if you are a model developer or Private Cloud administrator. For regular users, clicking it won’t do anything. |
|
|
Run the experiment (without animation). If the experiment has already been run, the button will be inactive and displayed as . |
|
|
Play the animation of the model. For both optimization experiments: If your experiment has the feasible solution, play the animation of the run that leads to that solution. If there is none, play the animation of the run closest to feasibility. For optimization with replications: Play the animation with the random seed specified in the experiment settings. |
|
|
Save inputs for the current experiment. |
|
|
Discard changes to inputs (restore the inputs to the previously saved values). |
|
|
Compare experiment runs. |
|
|
Export and download the experiment results as an Excel file. |
The ![]() button opens the additional commands menu:
button opens the additional commands menu:
|
|
Share the model. |
|
|
Model info (Navigate to the model screen). |
The sidebar is displayed on the left side of the experiment screen. The sidebar is organized as a two-level tree.
- The top level lists the existing model versions.
-
The lower level lists the experiments created for each model version:

To show or hide the sidebar
- Click the
 button in the upper left corner of the experiment screen.
To expand or collapse the list of experiments for the model version
- Click the model version node in the sidebar.
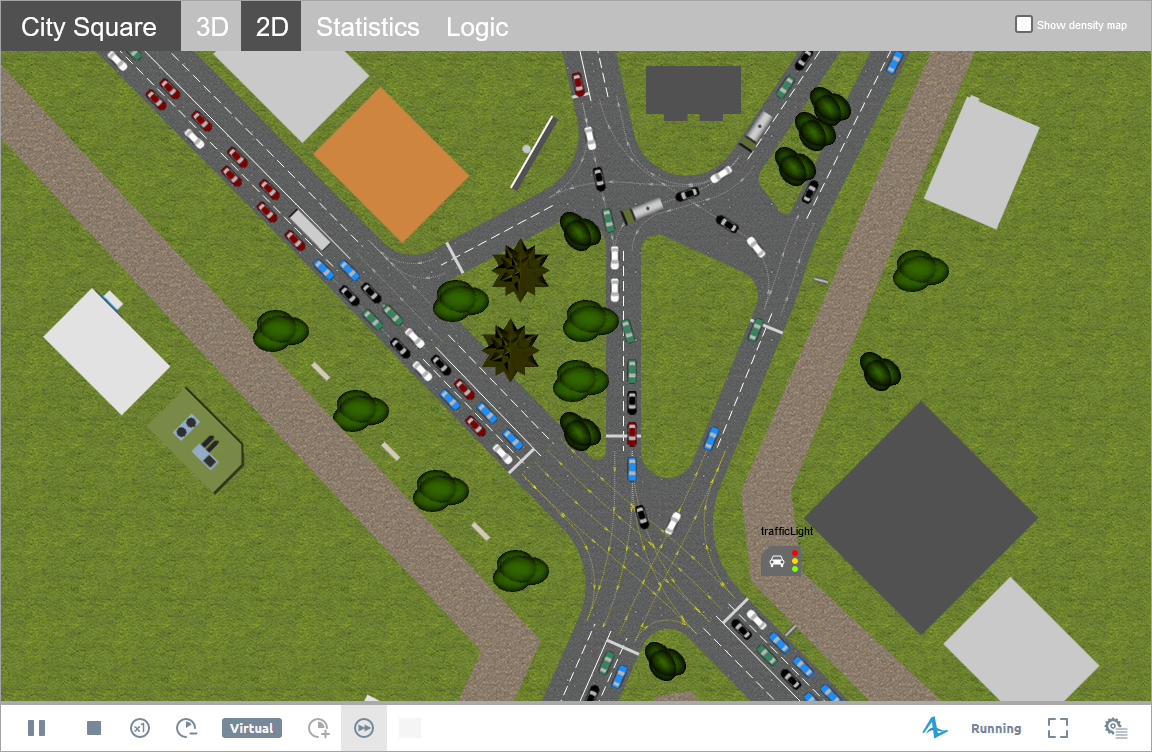
You can view the animation of a running model.
To view model animation
- Select the experiment in the sidebar.
- Provide the experiment input values in the Inputs section of the experiment dashboard.
-
Click the
 button on the experiment toolbar. The model animation opens in a pop-up window:
In AnyLogic Cloud, the model window is subject to the screen ratio of the device on which the model is run. If the device aspect ratio is different from the frame ratio specified in the AnyLogic IDE, it may result in the exposure of the elements that the model developer intentionally placed outside the model’s frame to hide them from the model’s end users.
The progress bar above the playback controls shows the progress of the model. It is active when the animation is set to stop According to model time settings in the Run configuration properties.
The model animation window provides you with a set of common playback controls:

|
Visible if the animation is not currently running. Runs the animation or, if it was paused, resumes it from its current state. |
|
|
Visible if the animation is not currently running. Pauses the animation. |

|
Pauses the animation and closes the animation window. |

|
Pauses the animation and closes the animation window. |

|
Sets the real-time mode to the default scale. |

|
Slows down the animation by decreasing the model time scale to real time. |

|
Displays the current scale ratio of model time and real time. To change the current value, use the  and and  buttons. Displays buttons. Displays  , if the animation is running in the virtual time mode. , if the animation is running in the virtual time mode.
|

|
Accelerates the animation by increasing the scale of model time to real time. |

|
Toggles the animation between the virtual time and real time modes. If the virtual time mode is set, appears pressed. |

|
Displays the responsiveness of the model rendering.
|

|
Provides access to:
|

|
Displays the simulation status of the current run:
|

|
Displayed in the windowed playback mode. Switches the playback window to full screen mode. |

|
Displayed in the fullscreen playback mode. Switches the playback window to windowed mode. |

|
Opens the developer panel, which provides access to the additional model controls, simulation data, and the console with the experiment’s output.
For this button to be available, the developer panel must be enabled in the appropriate property of the model’s run configuration.
|
-
How can we improve this article?
-


 — Downloading data from external resources is in progress (such as
  — The response time is slightly below normal but doesn’t affect the animation performance much.
 — The response time is critically low and significantly affects the animation performance.