

This document lists questions that were frequently asked by our customers along with solutions.
If you have searched for the solution of your problem and found that it is still neither mentioned in AnyLogic documentation nor in this FAQ, feel free to contact our technical support group using the  Get Support toolbar button.
AnyLogic Support Team will gladly help you to solve all your problems, either technical (for example, if a model does not compile successfully, throwing out an error) or modeling ones (for example, what modeling approach to use to solve a specific problem).
- How statecharts differ from flowcharts?
-
In AnyLogic we use diagrams that look similar (have boxes connected with arrows), but have different meaning or semantics. For instance: statecharts, process flowcharts, and stock and flow diagrams. It is worth considering the difference between these diagrams:
- Statecharts define internal states, reactions to external events, and the corresponding state transitions of a particular object: a person, a physical device, an organization, a project, and so on. The (simple) states of the statechart are alternative: at any given moment in time the statechart is in exactly one simple state.
- Process flowcharts (composed of the Process Modeling Library blocks) define sequences of operations performed over agents-entities. During the simulation there may be multiple agents in different places of a flowchart, so the “state” of the flowchart is actually spread across the whole diagram.
- Stock and flow diagrams are a fundamental part of system dynamics models. Stocks are accumulations and the state of the system is defined by the values of all stocks. Compared to statecharts, all stocks and all flows are simultaneously active.
- How to change the size of the model window?
-
By default, model window has the size of 1000*600 pixels. However, you can adjust it as required by resizing the frame.
- How to set up parameters from the simulation page before launching the model?
-
You can add controls onto presentation of your experiment and bind them to the parameters you want to modify.
To add controls modifying model parameters onto simulation experiment’s presentation
- Let’s study this by the example of our "Wandering Elephants" example model. You can see that this model has the parameter NumberOfElephants, defining the number of elephants. Let enable users to set up this parameter interactively from the simulation presentation page.
- First, we need to add a variable and bind it to the parameter we want to adjust.
- Open the diagram of the Simulation experiment.
-
Add elephants variable of type int.
Specify the variable’s Initial value: 50.
Since this variable is added for binding purposes only, we recommend to place it beyond the bounds of the model frame.
-
Add a
 slider to vary number of elephants. Specify elephants as the slider's Default value. Specify the Action of the slider:
elephants = (int)value; - On the General properties page of the experiment, specify elephants as the actual value of the parameter NumberOfElephants.
- Run the experiment and play with the slider. You will see that the model gets the parameter value you have specified on the experiment presentation page.
- How to obtain current model time value?
-
You can get current model (logical) time using the function time().
- How to find an element on the diagram?
-
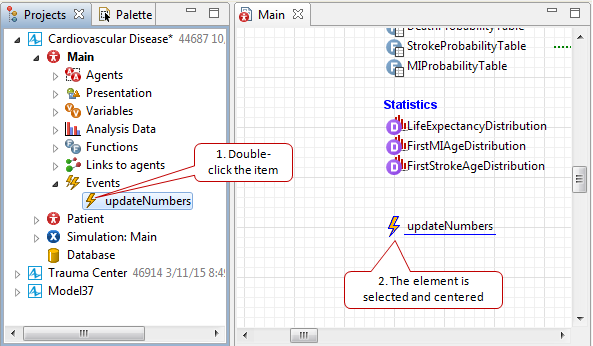
If for some reason you cannot find some element on the graphical diagram, use the Projects view. Expand the corresponding branch of the agent type or experiment in the Projects view tree and find the required element in the tree branch. Then double-click it: this selects the element in the diagram and centers the diagram, so the element appears in its center.
- How to find out the current mouse coordinates in the graphical editor?
-
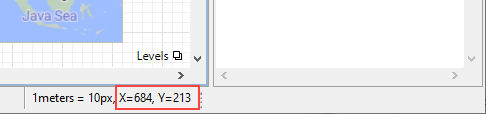
The current mouse coordinates in the graphical editor are displayed in AnyLogic status bar:
- What does the
 icon in the palette mean?
 -
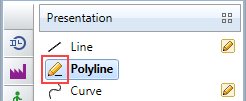
The pencil icon (
) drawn near a palette element means that this element supports the drawing mode. The drawing mode is the additional way of adding elements onto the diagram in addition to common drag’n’dropping.When you drag an element onto the diagram, you always get the shape of the predefined size and form. But sometimes you may want to draw a shape of the required form at once. In this case you should use the drawing mode.
To activate the drawing mode, double-click the element in the Palette. The element icon should turn to
:
Now you can draw a shape in the graphical editor using some common set of actions. However, these actions slightly differ for different elements:
-
State, Rectangle, Rounded Rectangle, Oval, Line
Drag to the graphical editor where you want to draw the shape. Stop dragging when you've got the shape of the required form and size. -
Connector, Transition, Polyline, Curve, Path, GIS Route, Railway Track, Road, Bulk Conveyor Belt, Pipe, Wall
Successively draw points of a shape by clicking at the required points on the diagram. Double-click to place the end point and finish.
-
State, Rectangle, Rounded Rectangle, Oval, Line
- How to refer to the top-level agent?
-
Each agent, living in owner agent, has a link to it. You may find the visual non-removable link on the agent diagram, above the X-axis.
If the top-level agent type name is Main, the name of the link is main.
In this case you are able to refer to the top level agent by name of this link, that is, main.
- How to pass a value to the standalone application as a command line argument?
-
To pass command line arguments to your standalone application you should simply specify the space-separated list of argument values (in the case of Windows, you type it in the application’s BAT file, after the enumeration of all required JAR files), for example:
25 107.8 "useful text"
Or, in the case you are the author of this standalone application, you can specify these values in the advanced Command-line arguments property of the experiment.
To capture these values in the model, please use the experiment’s getCommandLineArguments() function.
This function returns an array of command-line arguments passed to the standalone application. To get, say, the first argument from the list, you can call getCommandLineArguments()[0], to get the second one — getCommandLineArguments()[1], and so on.
The function will return the values of type String. You may parse numbers from String using these functions: Integer.parseInt(), Double.parseDouble().This “capturing code” can be placed, for example, in the experiment’s Initial experiment setup property.
- How to distribute models in a standalone way?
-
Since AnyLogic model is a Java application itself, it could be used as standalone application. For this purpose, AnyLogic Professional has a special feature allowing a user to export a model as a java application. To export a model, select it in the Projects view, choose Export from the File menu, then follow the instructions of the wizard.
In AnyLogic PLE and AnyLogic University Researcher, this option is not available and stand-alone model usage is prohibited by the License Agreement.
- Can I open an external application from AnyLogic model?
-
Yes, you can open external applications. For instance, the code below opens file.txt text file in Notepad application:
try { String link = "file.txt"; Runtime rt = Runtime.getRuntime(); Process pr = rt.exec("c:\\Windows\\notepad.exe" + " " + link); } catch (java.io.IOException e) { e.printStackTrace(); } - Can I add sound effects into my model?
-
Yes, you can use some third-party Java library. The following model demonstrates how to do it (to properly add a library’s JAR file refer to the Adding External Java Classes article). The sound is played when the user clicks the button at the model runtime. Please note that Java code that plays the sound is invoked in a separate Java thread. This enables doing simulation and playing the sound simultaneously.
Demo model: Model with Sound Effect Open the model page in AnyLogic Cloud. There you can run the model or download it (by clicking Model source files). Demo model: Model with Sound EffectOpen the model in your AnyLogic desktop installation. - Can I open a presentation of some agent from experiment page?
-
Yes, to open presentation of agent at model runtime, you need to add a button and type the following Java code in the Action of this button:
getExperimentHost().setPresentable(((Main)getEngine().getRoot()).company);Here top-level agent is named Main. Main contains agent named company. Click on the button will open the presentation of company, not the presentation of Main.
- Can I use Student t-distribution in AnyLogic?
-
Student’s t-distribution can be synthesized using normal and chi-square distributions. Both of them are implemented in AnyLogic.
- Is it possible to rotate icons of agents?
-
Some block based simulation platforms have block-flip and block-rotation features, in order to get more realistic simulation diagrams. Is there some way to rotate icons in AnyLogic?
There is no way to rotate icons of agents in AnyLogic. If you want to improve your model appearance, please use bent connectors (this approach is widely used in our demo models).
- Where should I place comments so that they will get into my library’s Javadoc?
-
I am currently developing a library in AnyLogic. Since I noticed that Javadoc documentation could be generated, I decided to integrate it within the library. Where exactly would I specify the Javadoc comments?
If you want to add some comments for library element so that they will get into the library’s Javadoc, you should type the required text on the Description property page of this particular element.
- How to draw triangles and polygons?
-
You can draw triangles and polygons with the polyline shape. Select the polyline’s Closed property, and optionally change its Fill color.
- How to add a shape on the presentation at runtime?
-
The myShape shape can be dynamically added onto presentation of some agent by calling the function presentation.add(myShape).
- How to rotate a shape dynamically around its centre, not upper left corner?
-
When you rotate a shape, it rotates around its origin of coordinates. So, if you want your shape to be rotated around its centre, you should anyhow make the centre of the shape the origin point. This can be done using a group.
First, you should add your shape to a new group: right-click (macOS: Ctrl + click) the shape and choose Grouping > Create a group. This creates a group at the centre of your shape and adds your shape to this group.
Then you should go to the Dynamic properties of this group and type your dynamic expression for rotation in the Rotation field. Now all contents of this group will be rotated around its origin point.
And finally you should remove the expression from the dynamic field Rotation of your shape since now the rotation is defined in the group properties.
- How to get the coordinates of the mouse click on the model presentation?
-
Please have a look at the given demo model. This model catches (and displays) the mouse coordinates when the user clicks on the presentation at the model runtime.
The implementation is the following: a rectangle is drawn on the diagram. When the user clicks on the rectangle, the code of its On click dynamic parameter is executed. The mouse coordinates are available there as clickx and clicky.
Demo model: Getting Mouse Coordinates Open the model page in AnyLogic Cloud. There you can run the model or download it (by clicking Model source files). Demo model: Getting Mouse CoordinatesOpen the model in your AnyLogic desktop installation. -
You can create a button on the animation, and then add the following code to its Action:
getExperimentHost().openWebSite("www.anylogic.com");If you press that button, your default browser starts and opens the specified website (in this example it opens The AnyLogic Company website).
- How to count agents passed through the flowchart block?
-
You should use the function count(). For example, if you have source block and want to know how many agents left its output port, type source.count().
- How to add custom attributes to the agent?
-
Create new agent type and add the required parameters, and variables on the graphical diagram of the agent type.
- How to create agents in particular moments of time?
-
The Source block has a set of different agent generation modes. If you want to control moments of agent generations, choose Manual (call inject() function) one.
To generate some agents in this mode, you will need just to call the function source.inject(some_value);
where some_value is the number of agents you want to generate at the current moment.
You can call this function, for example, in actions of events, transitions, and so on — whenever you need.
- How to measure agent’s “time in system” or “length of stay”?
-
Process Modeling Library contains a pair of blocks (TimeMeasureStart and TimeMeasureEnd) measuring the time the agents spend between two points in the flowchart, such as “time in system”, “length of stay”, and so on.
Demo model: Measuring Length of Stay Open the model page in AnyLogic Cloud. There you can run the model or download it (by clicking Model source files). Demo model: Measuring Length of StayOpen the model in your AnyLogic desktop installation. - How to make resources work according a schedule?
-
To implement this, you should define the schedule. Then you should choose By schedule in the Capacity defined parameter of your ResourcePool block and specify the name of this schedule in the Schedule field below.
Please refer to the given demonstration model for the implementation.
Demo model: Implementing Work Shifts for Resources Open the model page in AnyLogic Cloud. There you can run the model or download it (by clicking Model source files). Demo model: Implementing Work Shifts for ResourcesOpen the model in your AnyLogic desktop installation. - How to change agent shape when it is inside a flowchart block?
-
Please have a look at the Changing Agent Shape model. The model demonstrates how to change agent’s animation shape when it is in some particular flowchart block.
Here we have agent type Box. It contains two different animation shapes placed in the same place (centered at the axis origin point): boxOpened, and boxClosed.
By default, boxClosed is visible, while for boxOpened we set Visible: no.
So, agents entering the first conveyor are displayed as closed boxes. Entering the second conveyor, the downstreamConveyor On enter code action is executed.
There we make the shape boxClosed invisible: agent.closedBox.setVisible(false);
And vice versa make the shape openedBox visible: agent.openedBox.setVisible(true);
To be able to access Box attributes in a simple way, specify Box as the Source’s New agent.
Demo model: Changing Agent Shape Open the model page in AnyLogic Cloud. There you can run the model or download it (by clicking Model source files). Demo model: Changing Agent ShapeOpen the model in your AnyLogic desktop installation. - How to obtain agents that are currently inside a flowchart block?
-
You can create a collection, add agents into this collection when they enter this particular Process Modeling Library block and remove them from there when they exit the block. Thus, you will always have actual list of agents currently being stored in the block.
- How to connect Process Modeling Library blocks dynamically?
-
You can connect and disconnect ports of AnyLogic library blocks (for example, the Process Modeling Library blocks) dynamically by calling connect() and disconnect() functions of block ports.
The following demo model illustrates how to connect Process Modeling Library blocks dynamically. It has two separate parts of a flowchart that are connected by clicking on the button placed between them. Please have a look at the button’s Action to understand the approach.
Demo model: Connecting Library Objects Dynamically Open the model page in AnyLogic Cloud. There you can run the model or download it (by clicking Model source files). Demo model: Connecting Library Objects DynamicallyOpen the model in your AnyLogic desktop installation.You can connect the out port of the block A and the in port of the block B only if no agent has been yet in the block A.
You also cannot disconnect the ports if some agent(s) have already passed through this connection. - How to change flowchart block’s parameter at model runtime?
-
Parameters can be modified dynamically at the model runtime.
To change a value of some parameter, you should call the automatically generated function set_parameterCodeName(), passing the value you want to assign as a function parameter.
For example, to change the Capacity of the queue block to 50, you should call queue.set_capacity(50);
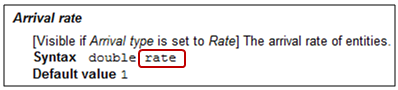
You may ask — how can I know the correct Java name of the parameter, I can see only labels like Arrival rate in the Properties view. To find out the programmatic name of some parameter, we recommend you to refer to the Process Modeling Library Reference Guide. There you can find the full description of block parameters. For example, to find the code name for Source’s Arrival rate, open the help document on the Source block and search for the Arrival rate section. Here you can find the required name in the Syntax row:
 Here we talk about static parameters, not dynamic ones. Dynamic parameters are evaluated each time they are needed, that is, each time the delay time, the speed, or other property of an agent needs to be obtained, so they do not have any persistent value, and it is meaningless to speak about changing values of dynamic parameters.
 - How to implement a resource that releases itself on timeout expiry?
-
I would like to add a time factor to the resource so that the resource seized would release by itself after a specified time, for example, 60 seconds. That means a resource is released either “normally” by the Release block before 60s or by itself at exactly 60s after Seize. Is there any simple method to do that?
Demo model: Releasing Resource on Timeout Open the model page in AnyLogic Cloud. There you can run the model or download it (by clicking Model source files). Demo model: Releasing Resource on TimeoutOpen the model in your AnyLogic desktop installation.Please take a look at the given demonstration model. The functionality you are describing can be implemented in AnyLogic, however it requires using some more block. The general idea is the following: as it is not possible to “interrupt” the normal process flow exactly after 60 sec to release the agent and then resume the process, we need to create a separate auxiliary “sibling” agent for each original agent that will actually seize the resource unit, wait for exactly 60 seconds and then release it. If by chance the original agent wants to release the resource earlier, it will tell its sibling to stop waiting for 60 seconds and release the resource immediately. To identify the sibling we are remembering the original agent hash code in the sibling’s id field. Please see the On exit code of delayArbitrary to find out how to extract the sibling.
If the pattern you are describing is met frequently in your model, we would recommend to create a new agent and put there all blocks inside the dashed line so that you do not have to create them all the time. The only drawback of this approach is that the resource unit is formally seized not by the original agent but by its sibling.
- How to obtain the batch size from Unbatch?
-
The batch size is accessible as batch.contents.size() from the On enter parameter of Unbatch.
- Is it possible to switch between different resource pools, choosing a resource depending on some parameter?
-
In some cases it is required to switch between several resource pools. Let’s say we should simulate the work of two support teams. Some requests are performed by the first one and some by the second one. We want to manually switch the team working with current agent depending on some parameter.
Yes, it is possible, but you cannot directly connect replicated ResourcePool to your Service, or Seize & Release blocks. If you setup more than one as Replication parameter of the ResourcePool block and ResourcePool is graphically connected to your flowchart block (Service, or Seize & Release), you will have the following error on launching your model: 'java.lang.RuntimeException: root.webServer.Process.seize: access: This object can only be connected to one ResourcePool object'.
The legal use case is the following. You should specify some expression evaluating the team to use in the ResourcePool Block parameter of your flowchart block, for example, agent.vip = 1 ? supportTeams.get(0) : supportTeams.get(1). So an ability to have replicated resource pools allows you to organize flexible resource pools switching.
- How to implement custom selection policy for resource units?
-
I need to choose the closest resource unit. The problem is that ResourcePool always selects the longest idle unit to assign, but I need to select the closest unit idle.
The attached model demonstrates how to implement any custom selections (not just closest, but also longest waiting, longest utilized, closest and red, closest and blue, and so on). The starting point is to migrate from ResourcePool to regular agents representing resources. Transporters become agents and Process Modeling Library blocks can be used to send these special agents to customers, move within the network, and so on. And let’s solve the closest issue first and then go to dynamic quantity. In the attached example there are two flows of agents both requiring Transporters and being processed in two different locations (therefore there is always a chose in selecting closest). When an agent arrives a special function selects a closest Transporter agent (if there are any, otherwise the agent waits). Then the transporter is sent to the agent location, both are matched and then processed. Finally the transporter is returned to a storage of idle transporters.
Demo model: Choosing Closest Resource Open the model page in AnyLogic Cloud. There you can run the model or download it (by clicking Model source files). Demo model: Choosing Closest ResourceOpen the model in your AnyLogic desktop installation.
- Is it possible to import models in AnyLogic from other System Dynamics tools?
-
Yes, currently AnyLogic supports import of Vensim models. Now you can simply open Vensim model (File > Import > From Vensim menu item) and it will be converted into AnyLogic model analogous to the original Vensim model so you can easily continue developing it in AnyLogic.
- How can I access the automatically created datasets for dynamic variables?
-
The datasets automatically created for dynamic variables (when the corresponding option is chosen in the Advanced tab of the agent type’s properties) have names composed in the following way:
Type Name Description For scalar variables DataSet _ds_variable This is a single data set that was generated by AnyLogic for the variable variable For arrays DataSet[] _ds_array This is a flat array with a dataset for each element of this array variable array These datasets are intended primarily for internal use: they are displayed in inspect windows (yellow popup callouts) when you click on a variable at runtime and switch to chart view. However, you can obviously use them as you like.
- Is it possible to change the value of a flow or a dynamic variable?
-
To allow assigning some values from somewhere to a flow or to a dynamic variable, please make it a constant (by selecting the Constant checkbox in its properties).
- How many agents can I efficiently simulate?
-
AnyLogic can efficiently simulate up to several millions of agents. This certainly depends on software and hardware you use. To test the performance of an agent based model on your computer, please run the Bass Diffusion Agent Based example model — it is a good test of a model simulating 1 million of agents.
However, the agents in this model have rather simple internal structure. More parameters, states in their statecharts and other structure elements agents have, more memory is needed for calculations and handling the model.
But probably you should not raise a question in this way — much more interesting question is “How many agents do I need to simulate?” For example, if one needs to model the population of a country (like 100,000,000 people), does he need 100 million agents? The answer is: in most cases not necessarily! There are several techniques of reducing the number of agents to make the simulation computationally efficient yet giving the correct results. For example, if all regions in the country have the same conditions, you may model only one region with, say, population of 5,000,000 and then extrapolate the obtained results on the whole country. - How to dynamically add agents into a population?
-
We recommend you to create an agent and set its replication to zero. So you will be able to add the instance of this agent type and define its parameters in runtime by using the following function:
Assume you have population named patients:
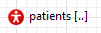 . The initial size of the population is 0. We want to add all agents in a population dynamically at model runtime.
To add an agent in a population at model runtime, call the auto-generated function add_agentPopulationName(). In our case, the name of the agent population is patients, so you should call the function add_patients().
And our agent Patient has two parameters: BMI and age. To set the values of the parameters for a just created agent, specify the parameter values using the arguments of the add_patients() function. Specify the values for all the parameters of this agent inside the function parentheses, separated by commas. Please note that the parameter values must be specified exactly in the same order as they appear on the properties page of the agent population (patients):
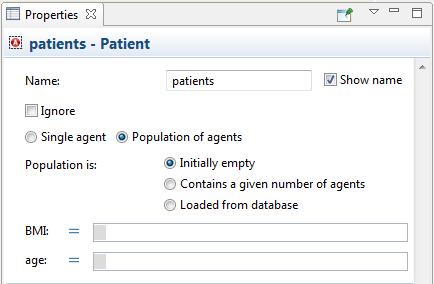
So, to create a new agent in a patients population and assign the value of 20 to its BMI parameter, and 80 to age, you should call the function: add_patients(20, 80);
To find out how to reorder parameters of agent population, check the section below.
Another example: please look at the given demo model. Agents are created there using the event newAgent. You can see the function add_people() called in the event’s action. This function creates new agents. It is named so because the replicated object that models the agent population is named people in this model.
Demo model: Event Generating New Agents Open the model page in AnyLogic Cloud. There you can run the model or download it (by clicking Model source files). Demo model: Event Generating New AgentsOpen the model in your AnyLogic desktop installation. - How to delete all agents from a population?
-
Please try the following code (here we assume your agent population is named people):
while( people.size() > 0 ) { remove_people( people(0) ); } - How to reorder agent parameters?
-
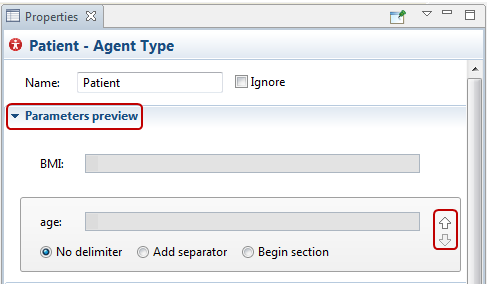
Please open the properties of the agent type (and not the agent population) and open the Parameters preview section of properties. There you will be able to reorder the parameters using the “arrow” buttons on the right side of the view.
- How to make agent move along a given path?
-
Agent has function moveTo(x, y, path) that initiates movement to a target (x,y) along a given polyline (path).
Demo model: Agent Moving Along Path Open the model page in AnyLogic Cloud. There you can run the model or download it (by clicking Model source files). Demo model: Agent Moving Along PathOpen the model in your AnyLogic desktop installation. - Can I move an agent from one space to another?
-
Direct migration of agents between spaces is not supported in AnyLogic.
Generally, two solutions are possible.
First one is to use the only space and additional variables to organize agents into logical groups. Algorithms of establishing connections between agents can also depend on those variables.
If, for some reason, having several spaces is required, the second solution is offered:
- remove the agent from first space
- create a new agent with same parameter values
- assign it to the second space
Some recalculations will probably be required depending on space type and connection establishing logic.
- How to find out how many agents entered the state by taking a particular transition?
-
There are several transitions leading to the same state. How can I find out how many agents entered this state by taking a particular transition?
You can create variables in your agent — one for a transition, for example, numTransitionA, numTransitionB, and so on. Each variable will count agents that took some particular transition. To increase value of a counter on taking a transition, type code like numTransitionA; in the Action property of this transition.
Or you may create several simple states inside the state you want to investigate. Each transition will lead to some particular simple state and you can create standard statistics functions to calculate number of agents that are currently inside this or that active state.
- Can I add a Gantt chart into my model?
-
AnyLogic does not support Gantt charts but you can create a similar chart by customizing AnyLogic time color chart, see the demo model below.
Demo model: Gantt Chart Open the model page in AnyLogic Cloud. There you can run the model or download it (by clicking Model source files). Demo model: Gantt ChartOpen the model in your AnyLogic desktop installation. - How to gather statistics from multiple replication runs?
-
You should add Statistics element onto your experiment diagram and use Before/After Simulation run advanced properties of the experiment you will be able to fill this statistics element with data from the model. So when the experiment finishes, you will be able to analyze it or export somewhere.
- Is it possible to adjust the Time Window of a chart dynamically?
-
Unfortunately, this property of charts cannot be changed at runtime. But you can create several similar charts with different time windows and play with their visibility, choosing this or that chart to be visible at the moment according to the current parameter values.
- How to know whether a state of a statechart is currently active or not?
-
Use the getState() function of the statechart or the inState() function of the agent. Please refer to this article for more details.
- How to obtain the remaining time before the transition is triggered?
-
If you have a transition named transitionA, you may use transitionA.getRest() to get the remaining time.
- How to obtain the remaining time before the event is triggered?
-
If you have an event named myEvent, you may use myEvent.getRest() to get the remaining time.
The getRest() function is not available if the event is triggered by condition.
- How to improve performance of a model with the logging being turned on?
-
If the simulation takes significantly more time with the logging being turned on, you can disable data collection for some logs that you do not need.
To turn off data collection for a log
- After you simulated your model at least once and got the logs collected, expand the
 Database branch in the Projects view.
 - Expand the
 Log item’s branch in the tree. You will see the list of logs in the Log branch.
 - In the Projects tree, select the log you do not need, and select the I do not need this type of log checkbox in the properties.
- After you simulated your model at least once and got the logs collected, expand the
- Can I turn off the GUI to speed up execution?
-
AnyLogic Professional includes the runFast() function which is added for this case.
In AnyLogic PLE and AnyLogic University Researcher you can use the Parameter Variation experiment with a single iteration. It runs the model with the runFast() function without efforts on animation at all.
- How to obtain the coordinates of a pedestrian?
-
You can get pedestrian’s coordinates by using the ped.getX(), ped.getY() and ped.getZ() functions. You’re able to access these functions of pedestrians from the Pedestrian Library blocks when pedestrian enters block, exits block, and so on.
- How to simulate pedestrian evacuation?
-
The Pedestrian Library has a built-in mechanism for handling evacuation cases. Nearly all Pedestrian Library flowchart blocks have the cancel(ped) and cancelAll() special functions. Use these functions in the case of evacuation. The first function interrupts the current command for the specified pedestrian and causes it to exit the block via the ccl port. The second one does the same for all pedestrians that are currently in the block.
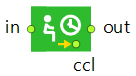
The ccl port is usually located on the lower border of the block’s icon (the figure below shows it on the PedWait example).
To define some custom behavior for evacuating pedestrians, you will need to define some alternative flowchart for that case and connect ccl ports of your flowchart blocks with the input port of PedEnter block that starts that alternative flowchart.
Moreover, when you call cancel(ped) and cancelAll() functions, the code specified in the block’s On cancel property is executed, so you can perform some additional actions with evacuating pedestrians, for example, change color of their shapes.
- How to set a custom animation shape for pedestrians?
-
You can animate pedestrians with any shapes and images. You can find more information here.
- How to simulate turnstiles?
-
You should draw the turnstiles graphically on top of your layout plan with the Service with Lines space markup shape. This element models services of one of two types: Delay and pass through, or Just delay. Use the first one if you need to model turnstiles. Delay and pass through service is defined by a line, along which pedestrians should move, and this meets the case of turnstiles.
Then you should add the Pedestrian Library PedService block into your pedestrian process flowchart to simulate how the pedestrians go through the turnstiles.
- How to make a pedestrian move towards another one?
-
You can get x and y position of any pedestrian while simulating. Then you could force the chasing pedestrian to go to the position of another pedestrian constantly (creating some kind of loop that includes the pedGoTo block and cancels it repeatedly when on cancel port leads again to the same block) while doing that you should update the position of the target that this PedGoTo block leads to (put the x and y positions of the followed pedestrian). If you want these pedestrians to move together after meeting, you may add them to a pedestrian group while the position will be close enough.
- How to implement sensors reacting to pedestrians within a certain range?
-
To implement this, follow these steps:
Create an event with the cyclic mode.
In the Action field of the event calculate the distance between pedestrian and other object of interest using sqrt((x2-x1)^2-(y2-y1)^2).
For multiple pedestrians you will need to put them into a list while injecting and inside the event use “for” loop calculating this distance for any of them.
While the result will be lower than the required value call the desired action.
- Can I use AnyLogic for simulating warehouse logistics?
-
Yes, AnyLogic is capable of detailed simulation modeling of warehouses based on physical dimensions of buildings, forklift trucks, shelves, products and pallets, aimed at finding the optimal management policy.
There is a specific space markup element Storage you can use to draw rack storages, and Material Handling Library contains a set of three blocks (Store, Retrieve, and Storage System) designed to simplify modeling of storages with multiple locations and regular structure, such as warehouse storages.
- Is it possible to set a storage to have some initial stock?
-
Yes, starting with version 8.9.5, AnyLogic supports storages with initial stock. You can set the Storage System to be initially filled with agents (material items) on model startup fully or partially, according to the properties of the StorageSystem block.
-
How can we improve this article?
-