

Canvas represents a rectangular area, within which you can draw by means of coding. The shapes you draw on the canvas can form either static or dynamic picture (if drawn and modified at model runtime). This feature allows you to use the canvas element for creating heatmaps (analogous to the AnyLogic’s density map). Another typical use of AnyLogic canvas is animation of the spatial distribution (for example, a pandemic, pollution, housing).
Canvas is a raster image. It maps directly to HTML5 canvas element. In contrast to vector graphics, any shapes drawn on the canvas become a part of a raster image and cannot be accessed afterwards. The just created canvas (as well as just cleared) is transparent.
Canvas is displayed only in 2D animation and is not shown in 3D animation scene.
To get more understanding of the canvas' application, please refer to the model mentioned below.
Demo model: Wandering Elephants Open the model page in AnyLogic Cloud. There you can run the model or download it (by clicking Model source files). Demo model: Wandering ElephantsOpen the model in your AnyLogic desktop installation.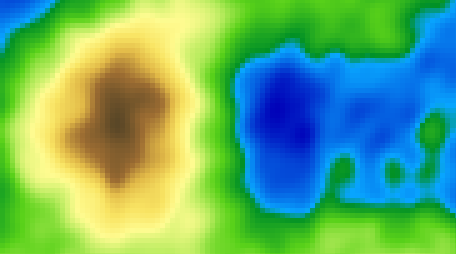
In the referenced model the canvas element is used for the two purposes:
- drawing elevation map — canvas contains a static picture drawn once.
- drawing vegetation map — canvas contains a dynamic picture that is redrawn constantly by modifying colors of the required shapes. You can find the code updating the canvas in the On draw advanced property of the canvasDrawGroup group.
Since it is much simpler to deal with standard AnyLogic presentation shapes (because they are accessible individually), we recommend to use canvases only if you experience poor animation performance.
To add a canvas onto presentation
- Drag the
 Canvas element from the
  Presentation palette to the graphical editor.
 -
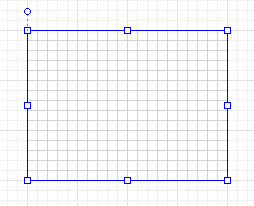
You will see a rectangular shape filled with a grid. Note that the grid is used only to depict the canvas’s area — it does not matter how many cells are drawn.
- Having added the canvas in the graphical editor, you can define what should be drawn on canvas using its functions (see the Drawing on canvas and Clearing canvas sections).
- General
-
Name — The name of the shape. It is used to identify and access the shape from code.
Ignore — If selected, the shape is excluded from the model.
Visible on upper agent — If selected, the shape is also visible on the upper agent where this agent lives.
Icon — If selected, the shape is considered as a part of the agent’s icon. Please note that icon shapes are not shown in 3D animation.
Lock — If selected, the shape is locked. Locked shapes do not react to mouse clicks — it is impossible to select them in the graphical editor until you unlock them. It is frequently needed when you use a shape as a background image for your animation and you want to prevent editing this shape while drawing other shapes over it.
Visible — Here you specify whether the shape is visible on the animation at the model runtime, or not. Choose yes or no using the control. If you expect visibility to change dynamically or to depend on some conditions, you may specify the expression defining the shape’s visibility here. This expression will be dynamically re-evaluated at the model runtime. It should return boolean value. The shape is visible when the specified expression evaluates to true, and not visible otherwise.
- Position and size
-
Level — Level to which this element belongs.
X — X-coordinate of the shape’s upper left corner.
Y — Y-coordinate of the shape’s upper left corner.
Width — Width of the shape (in pixels).
Height — Height of the shape (in pixels).
Rotation — Shape’s rotation angle in XY plane.
- Advanced
-
Show in — The option is set to 2D only and disabled since the canvas cannot be shown in 3D animation scene.
Show name — If selected, the shape’s name is displayed on the presentation diagram.
On click — Here you can type Java code that will be called each time a user clicks on the shape at the model runtime. If there are several shapes overlapping in the click point, the click will interact with the topmost shape only.
Local variables:
self — the element itself.
clickx — x-coordinate of the click relative to the shape coordinates.
clicky — y-coordinate of the click relative to the shape coordinates.
You can dynamically draw shapes on the canvas and modify the canvas properties at model runtime using the API of the corresponding class ShapeCanvas.
- Drawing on canvas
-
Function Description fillRectangle(double x, double y, double width, double height, java.awt.Paint color) Fills a rectangle with the given color on the canvas, preserving transparency.
x — the x coordinate of the top left corner of the rectangle.
y — the y coordinate of the top left corner of the rectangle.
width — the width of the rectangle.
height — the height of the rectangle.
color — the color or texture to use.fillCircle(double cx, double cy, double radius, java.awt.Paint color) Fills a circle with the given color on the canvas, preserving transparency.
cx — the x coordinate of the circle center.
cy — the y coordinate of the circle center.
radius — the radius of the circle.
color — the color or texture to usevoid setGlobalCompositeOperation(String type) Sets the type of composing operation to apply when drawing new shapes, where type is a string identifying which of the composing or blending mode operations to use.
The valid types are:
“source-over” — This is the default setting and draws new shapes on top of the existing canvas content.
“source-in”The new shape is drawn only where both the new shape and the destination canvas overlap. Everything else is made transparent.
“source-out” — The new shape is drawn where it doesn't overlap the existing canvas content.
“source-atop” — The new shape is only drawn where it overlaps the existing canvas content.
“destination-over” — New shapes are drawn behind the existing canvas content.
“destination-in” — The existing canvas content is kept where both the new shape and existing canvas content overlap. Everything else is made transparent.
“destination-out” — The existing content is kept where it doesn't overlap the new shape.
“destination-atop” — The existing canvas is only kept where it overlaps the new shape. The new shape is drawn behind the canvas content.
“lighter” — Where both shapes overlap the color is determined by adding color values.
“copy” — Only the new shape is shown.
“xor” — Shapes are made transparent where both overlap and drawn normal everywhere else.
“multiply” — The pixels are of the top layer are multiplied with the corresponding pixel of the bottom layer. A darker picture is the result.
“screen” — The pixels are inverted, multiplied, and inverted again. A lighter picture is the result (opposite of multiply).
“overlay” — A combination of multiply and screen. Dark parts on the base layer become darker, and light parts become lighter.
“darken” — Retains the darkest pixels of both layers.
“lighten” — Retains the lightest pixels of both layers.
“color-dodge” — Divides the bottom layer by the inverted top layer.
“color-burn” — Divides the inverted bottom layer by the top layer, and then inverts the result.
“hard-light” — A combination of multiply and screen like overlay, but with top and bottom layer swapped.
“soft-light” — A softer version of hard-light. Pure black or white does not result in pure black or white.
“difference” — Subtracts the bottom layer from the top layer or the other way round to always get a positive value.
“exclusion” — Like difference, but with lower contrast.
“hue” — Preserves the luma and chroma of the bottom layer, while adopting the hue of the top layer.
“saturation” — Preserves the luma and hue of the bottom layer, while adopting the chroma of the top layer.
“color” — Preserves the luma of the bottom layer, while adopting the hue and chroma of the top layer.
“luminosity” — Preserves the hue and chroma of the bottom layer, while adopting the luma of the top layer.
type — the type of composing to be applied from now. - Clearing canvas
-
Function Description void clear() Clears the whole canvas (makes it fully transparent). void clearRectangle(double x, double y, double width, double height) Clears a rectangle on the canvas (makes it fully transparent).
x — the x coordinate of the top left corner of the rectangle.
y — the y coordinate of the top left corner of the rectangle.
width — the width of the rectangle.
height — the height of the rectangle. - Location
-
Function Description double getX() Returns the X coordinate of the canvas (namely, the coordinate of its upper left corner). double getY() Returns the Y coordinate of the canvas (namely, the coordinate of its upper left corner). void setX(double x) Sets the X coordinate of the canvas (namely, the coordinate of its upper left corner).
x — the new value of X coordinate.void setY(double y) Sets the Y coordinate of the canvas (namely, the coordinate of its upper left corner).
y — the new value of Y coordinate.void setPos(double x, double y) Sets new location for the canvas (namely, the coordinate of its upper left corner).
x — the new X coordinate of the canvas’ upper left corner.
y — the new Y coordinate of the canvas’ upper left corner.void setPos(Point p) Sets new location for the canvas.
p — the Point object containing the new coordinates of the upper left corner of the canvas. - Size, scaling
-
Function Description double getWidth() Returns the width of the canvas. double getHeight() Returns the height of the canvas. void setWidth(double width) Sets the new width for the canvas.
width — the new value of the width.void setHeight(double height) Sets the new height for the canvas.
height — the new value of the height.double getScaleX()
double getScaleY()Returns the scale of the canvas along X (Y) axis. void setScaleX(double sx)
void setScaleY(double sy)Sets the scale of the shape along X (Y) axis.
sx — the new value of scale along X axis. *
sy — the new value of scale along Y axis. *void setScale(double sx, double sy) Sets the scales of the shape along both axes.
sx — the new value of scale along X axis. *
sy — the new value of scale along Y axis. *void setScale(double s) Sets the same scale of the shape along both axes.
s — the new value of scale along both axis. *Set to 1 to keep the original size. - Rotation
-
Function Description double getRotation() Returns the rotation of the canvas in radians, clockwise. void setRotation(double r) Sets the rotation of the canvas.
r — the new value of rotation in radians. - Visibility
-
Function Description boolean isVisible() Checks the visibility of the canvas. If the canvas is visible, returns true, otherwise returns false. void setVisible(boolean v) Sets the visibility of the canvas.
v — visibility: if true — the canvas is set to be visible, if false — not visible. - Draw mode (2D / 3D)
-
Function Description ShapeDrawMode getDrawMode() Returns the drawing mode of the shape (it defines where this shape is drawn: in 2D, 3D or 2D+3D animation). Since canvases can only be displayed in 2D animation, returns SHAPE_DRAW_2D. - Group
-
Function Description ShapeGroup getGroup() Returns the group containing this shape. - Level
-
Function Description Level getLevel() Returns the level, where this shape is located. - Points inside the shape
-
Function Description boolean contains(double px, double py) Test if the shape contains the point with the given coordinates. Returns true if the shape contains the point with the given coordinates.
px — the x coordinate relative to this shape’s container.
py — the y coordinate relative to this shape’s container.Point randomPointInside() Returns the randomly chosen point inside the canvas.
This function utilizes Random Number Generator of the Presentable object containing this shape. (Will throw an exception if the shape has been created from code and has not been added to any group, — in this case use randomPointInside(Random rng)).Point randomPointInside(java.util.Random rng) Returns the randomly chosen point inside the canvas. This function utilizes the given Random Number Generator.
rng — the random number generator.
-
How can we improve this article?
-