

We’ll start by creating a simple model that will simulate the pallets’ arrival at the job shop, their storage at the shipping dock and their arrival at the forklift area.
We will use the following layout:
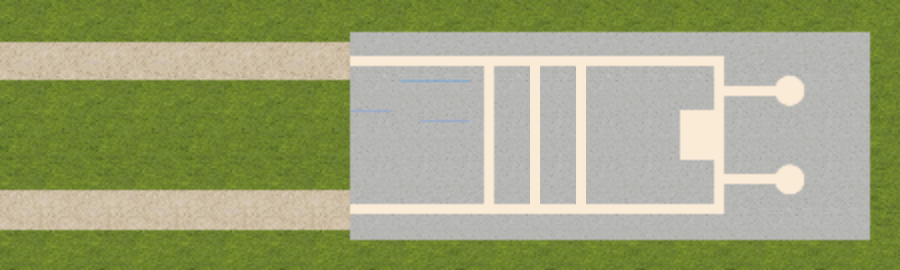
Right-click the image above, click Save image as and select the location for the image file.
-
Create a new model.
In the New Model wizard, set the Model name to Job Shop, and Model time units to minutes. -
Open the
 Presentation palette. The palette has several shapes that you can use to draw model animation, including a rectangle, a line, an oval, a polyline, and a curve.
-
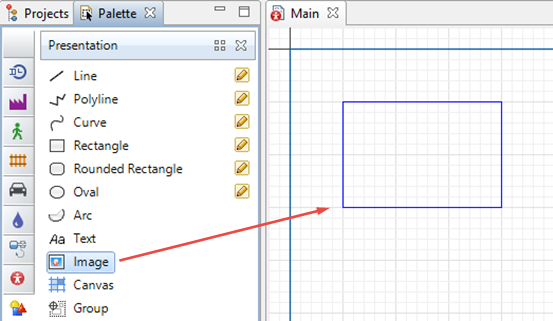
On the
Presentation palette, select the
 Image shape and then drag it on to the
 Main diagram. You can use the
Image shape to add images in several graphic formats — including PNG, JPEG, GIF, and BMP — to your presentation.
Main diagram. You can use the
Image shape to add images in several graphic formats — including PNG, JPEG, GIF, and BMP — to your presentation.
- You’ll see the dialog box that prompts you to choose the image file the shape will display.
-
Browse to the location of the image file you saved earlier (you can use the direct download link).
After you select the layout.png image, our diagram of the Main agent type should look like the following image:
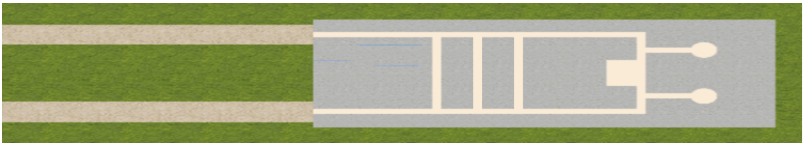
AnyLogic adds the image in its original size onto the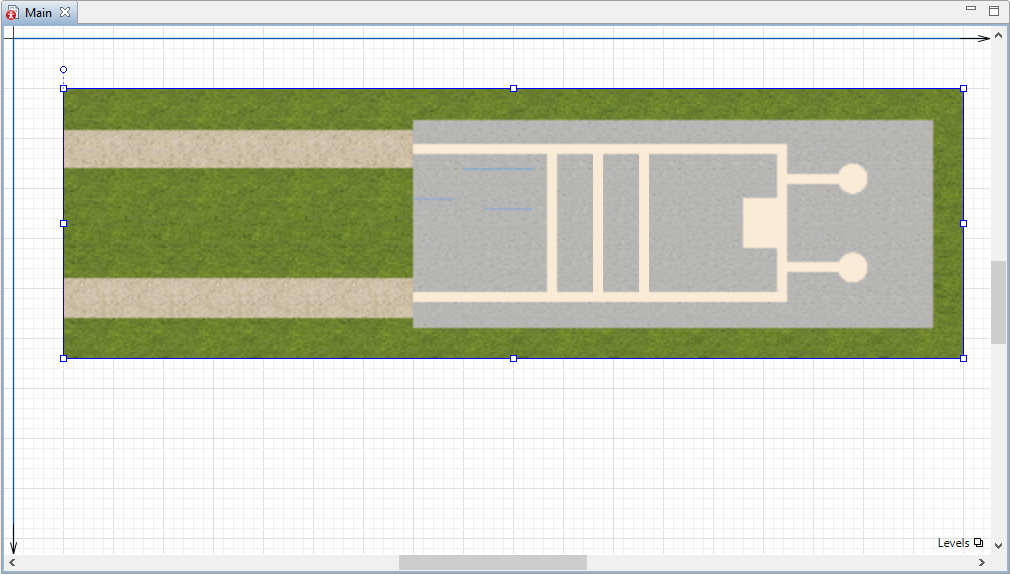 Main diagram, but you can also change the image’s width or length. If you distort the image’s proportions as in the figure below, you can revert to the image’s original size by opening the
 Properties view and clicking Reset to original size.
-
Select the image in the graphical editor. In the
Properties view, select the Lock check box to lock the image.
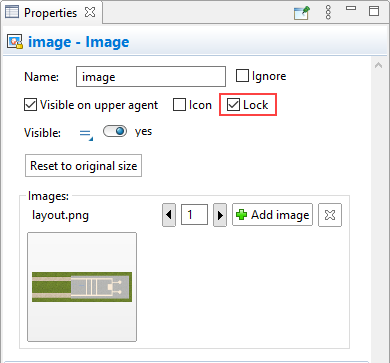
Locking shapes
You can lock a shape to ensure it doesn’t respond to your mouse click and you can’t select it in the graphical editor. You’ll find this very helpful as you draw shapes on top of layouts that represent facilities such as factories or hospitals.
If you need to unlock a shape, right-click in the graphical editor and select Unlock All Shapes from the menu.
Space markup elements
Our next step is to use the
 Space Markup palette to place space markup shapes on top of the job shop’s layout. We will use paths and nodes to create a network.
Creating a network
Paths and nodes are space markup elements that define the locations of agents:
- A Node is a place where agents may reside or perform an operation.
- A Path is a route that agents can use to move between nodes.
Together, nodes and paths make up a network that agents can use to move along the shortest paths between their origin and destination nodes. You’ll usually create a network when your model’s processes take place in a defined physical space and it has moving agents and resources. It is assumed that network segments have unlimited capacity, and the agents do not interfere with one another.
Now that you know a little bit about networks and their component parts, we’re ready to create a network that will define the movement paths for our model’s pallets. The first step is to use rectangular nodes to define specific areas on the job shop’s layout.
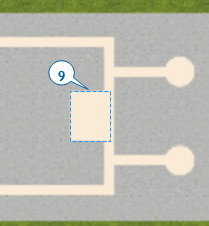
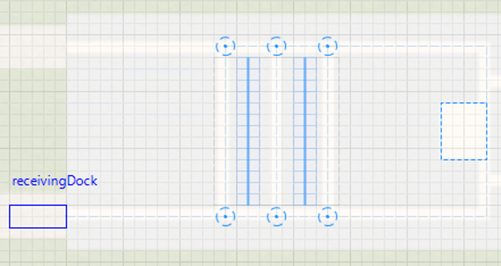
Draw the rectangular node over the job shop’s entrance, as shown in the figure below, to represent our model’s pallet receiving dock.
-
Open the
Space Markup palette, and drag the
 Rectangular Node element onto the
Main diagram. Resize the node. The node should look as in the figure below.
Rectangular Node element onto the
Main diagram. Resize the node. The node should look as in the figure below.
- Name the created node receivingDock.
-
Draw a node to define the location where the forklift trucks will park when they are idle and the agents no longer need them to complete a task. Use another
Rectangular Node to draw the parking area as shown in the figure below and then name this node forkliftParking.
-
Define your model’s warehouse storage by dragging the
 Storage element from the Material Handling section of the
Space Markup palette on to the layout and placing it as shown below.
Storage element from the Material Handling section of the
Space Markup palette on to the layout and placing it as shown below.
-
In the storage’s
Properties view area, specify the following:
- Set the Number of bays is property to calculated based on dimensions.
- In the Rack section, set Number of shelves: 2.
-
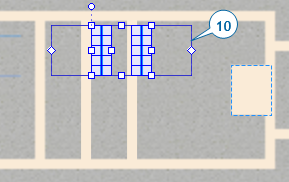
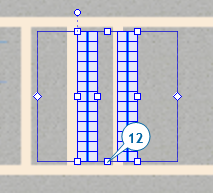
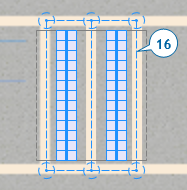
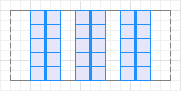
Resize the storage as shown in the figure below. With the settings you have previously set, the storage should have 13 bays.
-
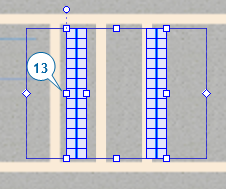
Position the left rack as shown below by dragging the marked handle to the left.
-
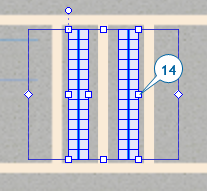
Similarly, by dragging the handle on the right side of the right rack place it between two aisles on our layout.
-
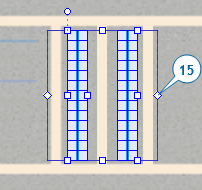
Decrease the access zone by dragging the rightmost handle as shown below.
-
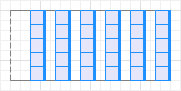
Now, when we’ve finished configuring the storage, it is time to create the network that will define paths allowing forklift trucks to reach every storage’s cell. Click the Create storage network button in the storage’s properties. Confirm the action in the dialog box, and you will see the network of nodes and paths created. This network will be used by forklift trucks to deliver and retrieve items from/to the storage.
-
Do the following to draw a movement path that will guide our forklift trucks:
-
In the
Space Markup palette, double-click the
 Path element to activate its drawing mode.
-
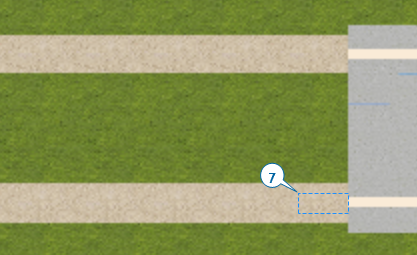
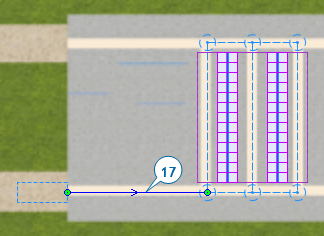
Draw the path as shown in the figure below by clicking the receivingDock border, and then clicking in the center of the bottom left point node of the network you’ve created for the storage.
-
In the
-
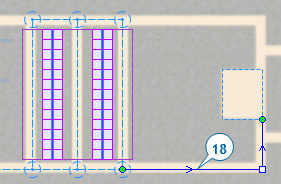
Draw one more movement path as shown in the figure below by clicking in the center of the bottom right point node, then clicking in the diagram to add the path’s turning point, and finally clicking the forkliftParking node’s border.
-
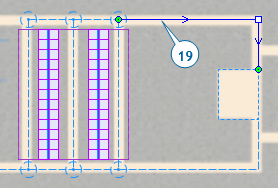
Similarly draw one more movement path as shown in the figure below.
-
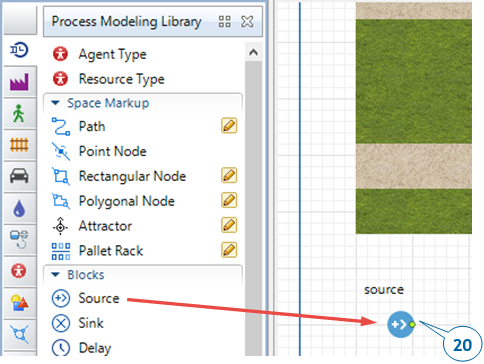
Drag the
 Source element from the
 Process Modeling Library palette on to the graphical diagram and name the block sourcePallets.
While the Source block usually acts as a process starting point, our model will use it to generate pallets.
-
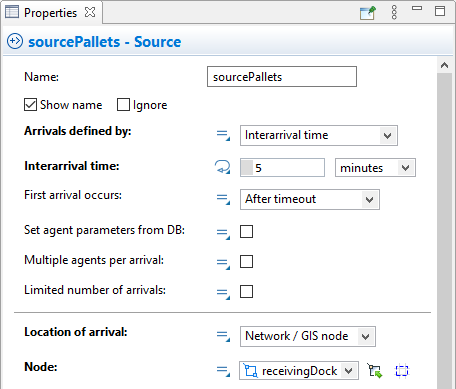
In the sourcePallets block’s
Properties view, do the following to ensure the model’s pallets arrive every five minutes and appear in the receivingDock node.
- In the Arrivals defined by area, click Interarrival time.
- In the Interarrival time box, type 5, and select minutes from the list on the right to have pallets arrive every five minutes.
- In the Location of arrival area, click Network / GIS node in the list.
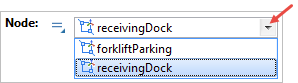
- In the Node area, click receivingDock in the list.
How to refer to model elements from block’s parameters
The block’s parameters offer two ways to select a graphical element:
-
You can select a graphical element from the list of available and valid elements that displays beside the parameter.
-
You can select a graphical element by clicking the selection button that displays beside the list. If you click the selection button, it will limit your choices to the available and valid elements that you can select by clicking in the graphical editor:
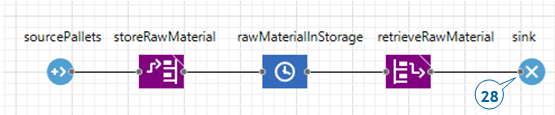
Continue constructing the flowchart. Now we need to add storage management logic, so it is time to use
 Material Handling Library blocks.
 -
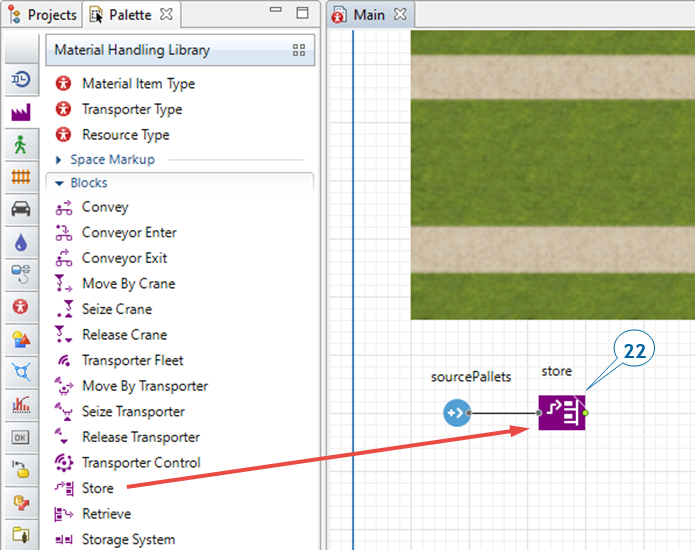
Switch to the
Material Handling Library palette and drag the
 Store block onto the diagram and place it near the sourcePallets block so they are automatically connected as shown in the image below.
The Store block places pallets into a given storage’s cells.
-
In the
Store block’s
Properties view, do the following:
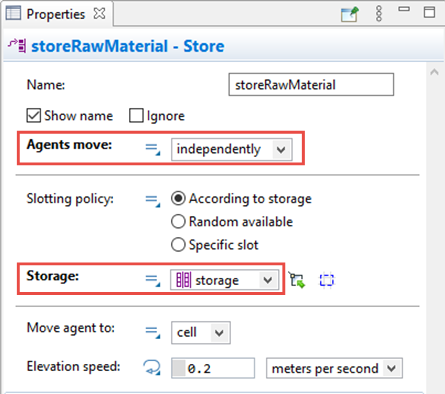
- In the Name box, type storeRawMaterial.
- Set that Agents move: independently. We do this now to run the first phase of our model without errors and see the intermediate results. In the next phase we will add resources (forklift trucks) to make the model more realistic.
- In the Storage list, click storage.
-
Add a
 Delay block from the
Process Modeling Library to simulate how pallets wait in the rack, and then name the block rawMaterialInStorage.
Delay block from the
Process Modeling Library to simulate how pallets wait in the rack, and then name the block rawMaterialInStorage.
You have probably noticed that AnyLogic automatically connects the block’s right port to the following block’s left port. Each library block has a left input port and a right output port, but you should only connect input ports to output ports.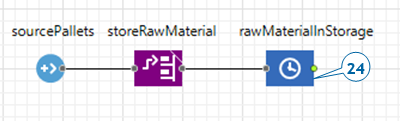
-
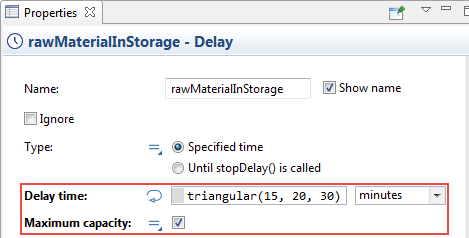
In the rawMaterialInStorage block’s
Properties view, do the following:
- In the Delay time box, type triangular(15, 20, 30) and select minutes from the list.
- Select the Maximum capacity check box to enable multiple agents to wait in the storage. The default capacity value is 1, and if you leave it, the agents will get stuck as they wait to be picked up from storage.
-
Add a
 Retrieve block from the
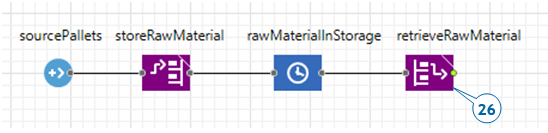
Material Handling Library , connect it to the flowchart, and then name it retrieveRawMaterial.
Retrieve block from the
Material Handling Library , connect it to the flowchart, and then name it retrieveRawMaterial.
In our model, the Retrieve block removes a pallet from a cell in the storage and then moves it to the specified destination.
-
In the retrieveRawMaterial block’s
Properties view, do the following:
- Set that Agents move: independently.
- In the Node list, click forkliftParking to specify where the forklift trucks should deliver pallets.
-
Add a
 Sink block. The
Sink block disposes agents and is usually a flowchart’s end point.
Sink block. The
Sink block disposes agents and is usually a flowchart’s end point.
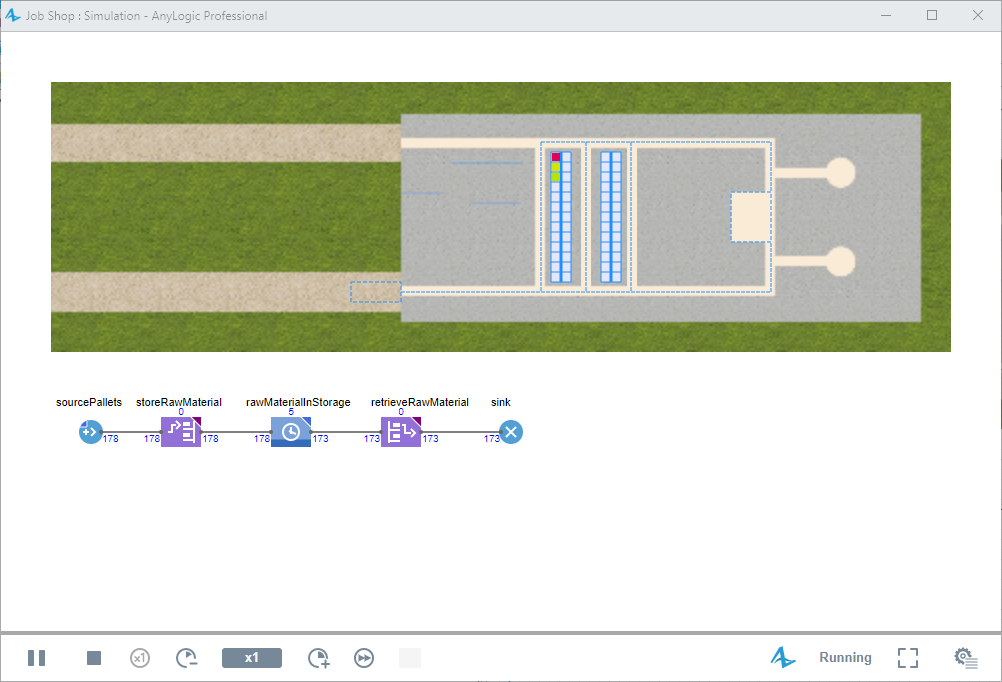
- We’ve finished building this simple model, and you can now run it and observe its behavior. Run the model (Job Shop/Simulation experiment). You will see how pallets appear at the job shop and then they are stored in the storage.
Storage
The
Storage space markup element graphically defines a storage, consisting of pallet rack(s). Each rack is composed of cells. A single cell can host a single agent (material item).
One storage element can contain multiple pallet racks. It supports the following alternative modes of the rack placement:
Back-to-back - the racks are organized in pairs back-to-back. This way each aisle provides access to two racks.
Stand-alone - all racks face in the same direction and each aisle can provide access to a single rack.
We will obviously use the back-to-back storage configuration (the default one).
Now let’s continue drawing a network by adding paths which will connect both nodes and the storage. First, draw the path connecting the storage to the node at the entrance, receivingDock.
Make sure the network elements are connected properly. If you have successfully connected the nodes with paths, the path’s connection points will display cyan highlights each time you select the path.
By default, paths in AnyLogic are bidirectional. However, you can limit movement along a selected path to one direction by clearing the Bidirectional property and then defining the movement direction. You can view a given path’s direction by selecting the path and then viewing the direction arrow that displays in the graphical editor.
We have marked up our model’s space by drawing the important locations and paths on top of our layout, and we will now use the AnyLogic Process Modeling Library to model the processes.
Process Modeling Library
The blocks in the
Process Modeling Library allow you to use combinations of agents, resources, and processes to create process-centric models of real-world systems. You learned about agents and resources earlier in this section, and we’ll build upon that foundation by defining processes as operations sequences that include queues, delays, and resource utilization.
Your model’s processes are defined by flowcharts, the graphical process representations you construct from the Process Modeling Library blocks. In the following steps, you’ll create the process flowchart.
-
How can we improve this article?
-