

Starting with version 8.9.9, AnyLogic supports the customization of inspection windows for agents, library blocks, and markup elements, making them more useful and flexible. Each element can have its own inspection window.
To open an inspection window, simply click an element while the model is running. This opens the default inspection window. With no changes to the properties, the inspection window is positioned over the element.
You can customize the appearance and output of the window by adding an  Inspection window element for each element that interests you, onto the diagram. Each such element has its own configurable properties; see below.
For more information on customizing inspection windows and their output for agents, see Inspecting agents.
The AnyLogic animation engine ensures that the inspection window is always visible over any element in the animation, regardless of its Z-height.
- To resize the inspection window, drag the handle in its bottom right corner.
- To reposition the inspection window, click the upper bar and move the mouse while holding down the mouse button.
-
Move the mouse pointer over the inspection window to access additional controls on its upper bar:
 — Copy the contents of the inspection window to the clipboard.
 — Close the inspection window.
The presentation API of AnyLogic also offers functions that allow to toggle inspection windows for specific elements or change their visibility; for more information, see Accessing the presentation.
Consider the following example model:
Demo model: Call Center Open the model page in AnyLogic Cloud. There you can run the model or download it (by clicking Model source files). Demo model: Call CenterOpen the model in your AnyLogic desktop installation.It has Service blocks where incoming calls are served by operators from a ResourcePool block. You can customize their inspection windows to add visual indicators and better formatting.
To configure the inspection window
-
Drag the
 Inspection window element from the
  Presentation palette onto the graphical diagram.
Position the window carefully, as this is where it will be initially located during runtime. - Open the properties of the inspection window.
-
In the Inspection window section, modify the Inspected element property to set the element that will be associated with the inspection window.
For this example, select service1. -
In the Inspection window text edit box, enter the following:
"Queue: " + element.queueSize() + (element.queueSize() > element.queueCapacity * 0.8 ? " (BUSY)" : " (OK)") + " | Delay: " + element.delaySize()
- Run the model.
Now, when you start the model and open the inspection window, it should show something like this:
Queue: 8 (BUSY) | Delay: 2
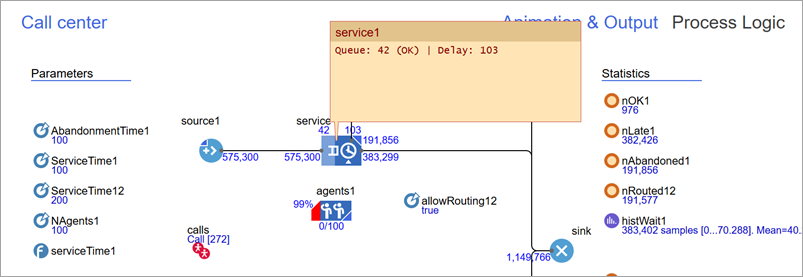
The custom inspection window code provides a visual output of the element, allowing to quickly identify bottlenecks. With the above code, the inspection window shows (BUSY) when the queue is almost full (at 80%, 0.8), and (OK) otherwise.
In the Inspection window text edit box, the element local variable always refers to the element that the window is connected to.
You can use a similar approach with other blocks, markup elements, and agents. Within the inspection window code, refer to the element by its code name to access its API, as well as custom functions, parameters, and variables.
- General
-
Name — The name of the shape. It is used to identify and access the shape from code.
Ignore — If selected, the shape is excluded from the model.
Visible on upper agent — If selected, the shape is also visible on the upper agent where the current agent that contains the shape lives.
Lock — If selected, the shape is locked. Locked shapes do not react to mouse clicks, so they cannot be selected in the graphical editor until they are unlocked. This is often necessary when using the shape as a background image for an animation and wanting to prevent editing of this shape while drawing other shapes over it.
- Inspection window
-
Inspected element — The element to which the inspection window is attached. If none is selected, the model will not build and an error will occur. When the element is selected, a “tail” is drawn between the inspection window and the element in the graphical editor. You can disable the “tail” in the Appearance section of the properties.
Additional controls are available to the right:
 — Allows to select the attached element in the graphical editor with a click.
 — [Visible if the window is attached to an element] Center the graphical editor on the attached element.
Inspection window text — Defines what will be shown in the inspection window during simulation.
To customize the output, call the element’s functions. For example, if you are configuring the inspection window for a Source block, you can show how many agents have exited through its out port by writing something like "Agents left through the out port: " + element.out.count().
Make sure the result is explicitly converted to a String: you can use "" + value or String.valueOf(value). Otherwise, a type mismatch error may occur.Show on startup — If selected, the inspection window is displayed immediately when the model run starts. The window appears exactly as configured and in the specified location. If this option is unchecked, then you will need to click the associated element during runtime. The inspection window will then appear with the specified settings.
- Appearance
-
Fill color — Sets the fill color for the element. Click inside the control and select a color from the set of the most used colors, or choose a custom color using the Colors dialog box.
Text color — Sets the color of the inspection window text. Click inside the control and select a color from the set of the most used colors, or choose a custom color using the Colors dialog box.
Show attachment — If selected, AnyLogic displays the “tail” that connects the inspection window and the associated element. This option affects both the graphical editor and the model runtime.
- Position and size
-
Level — The level to which this element belongs.
X — The X-coordinate of the inspection window (namely, its upper left corner).
Y — The Y-coordinate of the inspection window (namely, its upper left corner).
Width — The width of the inspection window, in pixels.
Height — The height of the inspection window, in pixels.
-
How can we improve this article?
-