

If none of the probability distributions supported by AnyLogic fits your data, you can define your own  custom (empirical) distribution.
Having defined the custom distribution, you can draw random values from your distribution by calling the function of the same name as your distribution, e.g.: myDistribution().
To define a custom distribution
- Drag the Custom Distribution element from the
 Agent palette onto the agent diagram.
 - Go to the element properties to define the distribution by entering data.
- First, choose the Type of the distribution. Type means the type of values the distribution returns, and can be one of the following:
- Continuous
- Discrete
- Then choose how the data of the distribution is defined, using the Define using control. There are several options:
- Frequency table
- Observed samples
- Ranges (only for Continuous type)
- Options (only for Discrete type)
- Define the data for a custom distribution in the Data section of the element's properties. There are three options:
- To load data from the AnyLogic database, select the Loaded from database check box and choose the database table from the Table drop-down list. If needed, define the conditions specifying the particular values you want to select from the database table in the Choice conditions option. Using the properties below, specify the DB table columns containing the required data (using the controls shown below).
- If you have table data already defined in any other application or a file, you can copy it to the Clipboard and paste it into the Data section by using the
 Paste from Clipboard button. Make sure to clear the Loaded from database check box first.
 - You can also enter the table data into the table manually. The table is shown in the Data properties section (if the Loaded from database check box is cleared). To remove an entry, select the corresponding row of the table and click the
 Delete button. Use
  ,
,  to rearrange the table rows (available if Frequency table or Observed samples is set in the Define using option).
- General
-
Name — The name of the custom distribution. The name is used to access the custom distribution. You call the distribution like a function, e.g.: myDistribution().
Show name — If selected, the element is displayed on the graphical diagram.
Ignore — If selected, the custom distribution is excluded from the model.
Visible — Here you specify whether the element is visible on the presentation at the model runtime, or not. Choose yes or no using the control.
Type — The type of the distribution:
- Discrete — The distribution returns discrete data: it can return only one of the values defined for the distribution in the table.
- Continuous — The distribution returns continuous data, i.e., it can return any value from the specified range.
Define using — Specify whether to define the distribution by:
- Frequency table — Defines the distribution with a frequency table. You specify the possible values and their weights.
- Observed samples — Loads the observed values as they are.
- Ranges — [Visible only if the Type is Continuous] Defines the distribution with ranges.
- Options — [Visible only if the Type is Discrete] Allows to specify probabilities for each alternative option in the chosen option list.
Returns integer values — [Visible only if Define using is set to Ranges] If selected, the custom distribution will return integer values only, and the ranges will include both start and end points. If cleared, each range will include only its start point, but not end point.
Option list — [Visible only if Define using is set to Options] Here you select the option list for this custom distribution. The distribution will define the probability of occurrence for each option in this list.
- Data
-
Here you define the data for the custom distribution. Data can be specified in the table, or loaded from the AnyLogic database.
Loaded from database — If set, allows to load data from the existing AnyLogic database defined by the user.
Table — [Visible if Loaded from database is selected] Here you can select the table of the AnyLogic database that contains the required data.
Choice conditions — Here you define one or several conditions that will specify the particular values to be selected from the specified table column. You can add
 , duplicate
  , delete , and arrange the conditions (, ).
Value column — [Visible if Frequency table or Observed samples is selected in the Define using option] The column of the database table that contains values.
Weight column — [Visible only if Frequency table is selected in the Define using option] The probabilities for the corresponding values in the Value column.
Start column — [Visible if Ranges is selected in the Define using option] The column of the database table that contains values the data ranges start from.
End column — [Visible if Ranges is selected in the Define using option] The column of the database table that contains values the data ranges end with.
Option column — [Visible only if Options is selected in the Type option] The column of the database table that contains options of the option list. This column's Type should be exactly the same option list that is specified in the Option list property of this custom distribution.
Number of observations column — [Visible if Ranges is selected in the Define using option, or if Options is selected in the Type option] The column of the database table that contains the data (numbers of observations for corresponding ranges, or for options of the option list). This column must contain only numeric values.
- Preview
-
Here you can see the custom distribution preview — the histogram built from 100 000 samples generated according to the custom distribution you have defined.
If the Invalid Data message is shown, please check the data in the Data section — something is wrong there, e.g. you use Define as: Ranges mode, and there are overlapping ranges defined in your table.
If the No Data message is shown, it means that you have not defined any data in the Data section of the distribution's properties, you should define distribution data in the table located there.
- Advanced
-
The Advanced property section is shown only if the Library developer mode is enabled.
Static — If selected, the custom distribution is static. Static distribution is initialized once and has the same data for all instances of that agent type. This is very useful in agent-based models, in case your agents have some distributions defined. By making a custom distribution static, the AnyLogic engine does not waste time on initializing it several times for numerous agents.
Do not use static custom distributions if you plan to run iterations of complex experiments (optimization, parameter variation, etc.) in parallel on different processor cores (this is set by the experiment's advanced option Allow parallel evaluations).Static custom distributions are not saved to a snapshot file when you save/restore a state of a running model. If you do not change the data of a static custom distribution in your model, the state of the restored model will be exactly the same as you saved it into the snapshot. However, if you somehow change the data of a static custom distribution (e.g. in the agent's On startup code), the modified data will not be saved into a snapshot, and the restored state of the model will differ from the state you have previously saved.
In the Observed samples mode you simply load the observed values as they are. The frequency of the particular value depends on the number of times this value is met in the table (i.e. number of times this value was observed). Use this mode if you have a table of observed data. The easiest way to load data into the model is to load it from your database, or copy it to the clipboard from the data source file or a program and paste the data by clicking the Paste from Clipboard button below the table in the Data property section.
- Example
-
In the given example we have defined a discrete custom distribution. In the Data table you can see real values, there is no restriction to have only integer values defined for a discrete distribution, you may have real values as well.
As you can see, two values (3.0 and 4.0) are listed twice, other values are listed just once. So these values (3.0, 4.0) have two times greater weight (which relates to the occurrence probability).
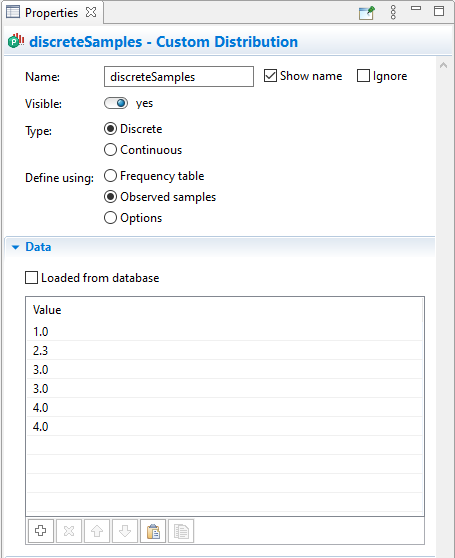 Discrete distribution defined using Observed samples
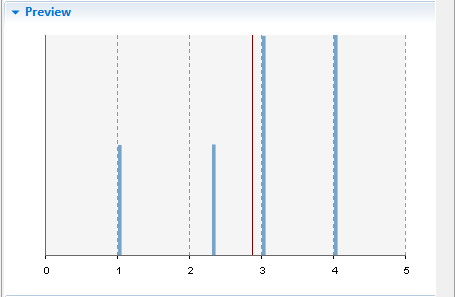 Distribution's Preview
You define a continuous custom distribution in the same way as described above for a discrete custom distribution. However, all values from the composed value range can be returned by the distribution, not just the values that are present in the Data table.
In the Frequency table mode, you define values in the first column of the table and the corresponding weights in the second column. If the distribution is Continuous, linear interpolation is applied, so actually you define sloped ranges.
- Example
-
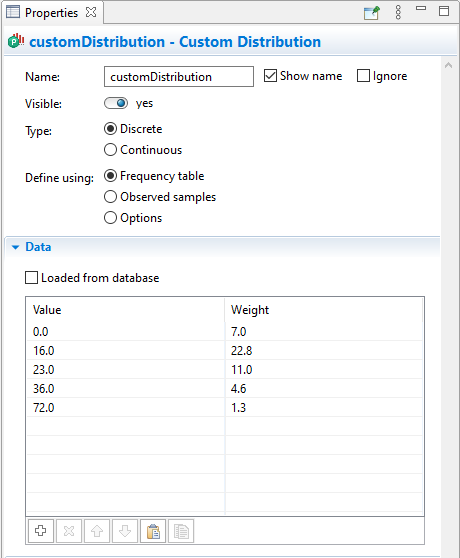 Discrete distribution defined using frequency table
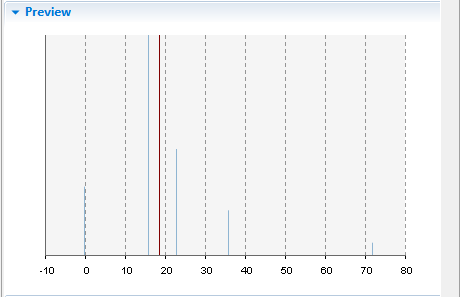 Discrete distribution's preview
Below, you can see the preview of the continuous custom distribution built for the same frequency table:
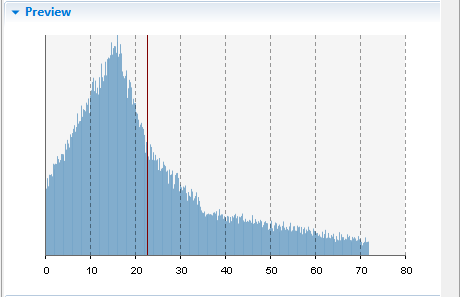 Continuous distribution's Preview
Choose the Continuous type of the custom distribution and then select the Define using: Ranges option.
Define ranges and probabilities (weights) for these ranges. The ranges may not follow one another, e.g.: [0, 12], [14, 22].
- Example
-
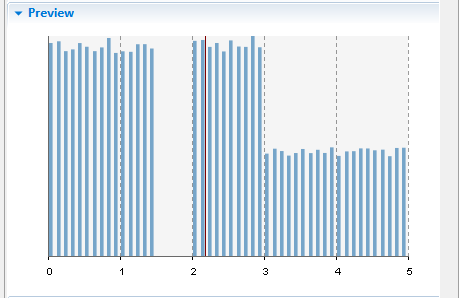
In the example shown below the Returns integer values option is disabled, so the ranges do not include the end points, and both the second and the last ranges have a value of 3.0, which is used to define the start/end point of the range.
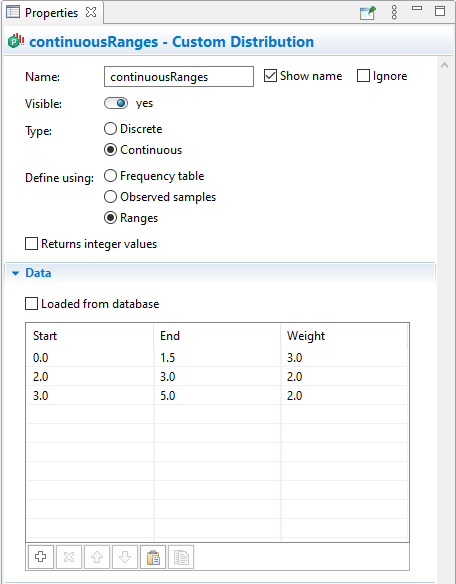 Continuous distribution defined using ranges
The preview of the custom distribution is shown below. As you can see here, no data is defined for the range (1.5, 2). The ranges (2, 3) and (3, 5) have the same weight, but the preview shows that the probability of the values in the (2, 3) range is higher since this range is smaller than the (3, 5) range.
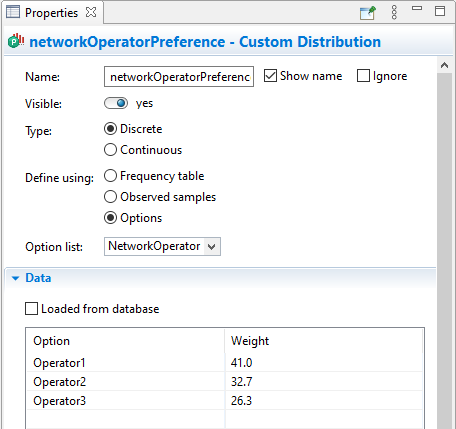
Choose the Discrete type of the custom distribution and then select the Define using: Options option. Choose the required option list in the Option list drop-down list and then define probabilities for alternative options of the chosen option list.
- Example
-
Assume we have the NetworkOperator option list in the model defining names of major network operators in the country:
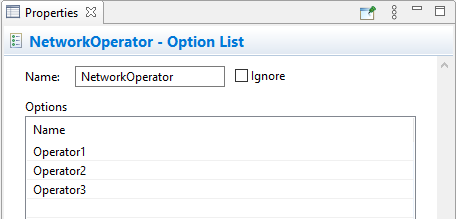
The custom distribution defining the preference of a specific network operator may look as follows:
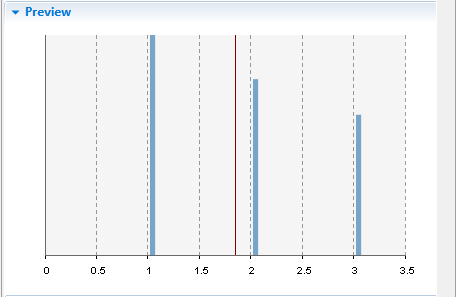
If you open the distribution’s Preview section of properties, you will see the following PDF:
AnyLogic supports two ways of creating an empirical distribution programmatically:
- You can create a custom distribution from an existing table function using the table function's API.
- You can use one of the constructors of the corresponding Java class.
The corresponding API is described below.
- Creating a distribution from a table function
-
Function Description CustomDistributionAbstract<Double> createCustomDistribution() Constructs and returns a custom distribution from the table function. Takes the table function's interpolation type and checks if it is supported. The random number generator is not set after this constructor and must then be provided in each call of get(Random) method. CustomDistributionAbstract<Double> createCustomDistribution( Random random ) Constructs and returns a custom distribution from the table function. Takes the table function's interpolation type and checks if it is supported. The random number generator is set after this constructor, so you can use both get() and get(Random) methods.
random — random number generator that will be used - CustomDistributionDiscrete() constructors
-
Constructor Description CustomDistributionDiscrete( double[] samples ) Constructs a custom distribution from the array containing observed samples. The array can be unsorted, and can contain duplicate values — the number of value occurrences defines the weight of the value.
samples — the array of observed samplesCustomDistributionDiscrete( double[] samples, Random random ) The same as CustomDistributionDiscrete(double[] samples), but enables using a custom random number generator.
samples — the array of observed samples
random — random number generatorCustomDistributionDiscrete( double[] values, double[] weights ) Constructs a custom distribution from the given array of values and weights. N values with weights will be converted into N-1 ranges, which define a piecewise linear function for the probability distribution function.
values — the array of values (at least two), duplicate values are not allowed
weights — the array of weights (same size as values, negative values are not allowed)CustomDistributionDiscrete( double[] values, double[] weights, Random random ) The same as CustomDistributionDiscrete(double[] values, double[] weights), but enables using a custom random number generator.
values — the array of values (at least two), duplicate values are not allowed
weights — the array of weights (same size as values, negative values are not allowed)
random — random number generatorCustomDistributionDiscrete( Map<Double, Double> valuesWeightsMap ) Constructs a custom distribution from the given map with values and weights.
valuesWeightsMap — map with <value, weight> pairs (negative values are not allowed)CustomDistributionDiscrete( Map<Double, Double> valuesWeightsMap, Random random ) The same as CustomDistributionDiscrete(Map<Double, Double> valuesWeightsMap), but enables using a custom random number generator.
valuesWeightsMap — map with <value, weight> pairs (negative values are not allowed)
random — random number generator - CustomDistributionContinuous() constructors
-
Constructor Description CustomDistributionContinuous( double[] samples ) Constructs a custom distribution from the array containing observed samples. The array can be unsorted, and can contain duplicate values — the number of value occurrences defines the weight of the value.
samples — the array of observed samplesCustomDistributionContinuous( double[] samples, Random random ) The same as CustomDistributionContinuous(double[] samples), but enables using a custom random number generator.
samples — the array of observed samples
random — random number generatorCustomDistributionContinuous( double[] values, double[] weights ) Constructs a custom distribution from the given array of values and weights. N values with weights will be converted into N-1 ranges, which define a piecewise linear function for the probability distribution function.
values — the array of values (at least two), duplicate values are not allowed
weights — the array of weights (same size as values, negative values are not allowed)CustomDistributionContinuous( double[] values, double[] weights, Random random ) The same as CustomDistributionContinuous(double[] values, double[] weights), but enables using custom random number generator.
values — the array of values (at least two), duplicate values are not allowed
weights — the array of weights (same size as values, negative values are not allowed)
random — random number generatorCustomDistributionContinuous( double[] starts, double[] ends, double[] weights ) Constructs a custom distribution from the given arrays of range start values, range end values, and range weights. Ranges should not intersect. The end of one range can be the beginning of another range. For example, ranges [0; 2] and [2; 3] are valid, whereas [0; 2] and [1; 3] are not.
starts — the array of range start values (at least one value)
ends — the array of range end values (same size as starts, each end value should exceed the corresponding start value)
weights — the array of weights (same size as starts, negative values are not allowed)CustomDistributionContinuous( double[] starts, double[] ends, double[] weights, Random random ) The same as CustomDistributionContinuous(double[] starts, double[] ends, double[] weights), but enables using custom random number generator.
starts — the array of range start values (at least one value)
ends — the array of range end values (same size as starts, each end value should exceed the corresponding start value)
weights — the array of weights (same size as starts, negative values are not allowed)
random — random number generator - CustomDistributionOptions() constructors
-
Constructor Description CustomDistributionOptions( E[] values ) Constructs a custom empirical distribution from array with occurrences. The number of value occurrences defines the weight of the value.
values — non-empty array of values (values can repeat and be unsorted)CustomDistributionOptions( E[] values, Random random ) The same as CustomDistributionOptions(E[] values), but enables using a custom random number generator.
values — non-empty array of values (values can repeat and be unsorted)
random — random number generatorCustomDistributionOptions( E[] values, double[] weights ) Constructs a custom empirical distribution from arrays of values and weights.
values — non-empty array with values (duplicates values are not allowed)
weights — array of weights (same size as values, no negative weights)CustomDistributionOptions( E[] values, double[] weights, Random random ) The same as CustomDistributionOptions(E[] values, double[] weights), but enables using a custom random number generator.
values — non-empty array with values (duplicates values are not allowed)
weights — array of weights (same size as values, no negative weights)
random — random number generatorCustomDistributionOptions( Map<E, Double> valuesWeightsMap ) Constructs a custom empirical distribution from the given map with values and weights.
valuesWeightsMap — map with <value, weight> (non-empty, no negative weights)CustomDistributionOptions( Map<E, Double> valuesWeightsMap, Random random ) The same as CustomDistributionOptions(Map<E, Double> valuesWeightsMap), but enables using a custom random number generator.
Constructs a custom empirical distribution from the given map with values and weights.
valuesWeightsMap — map with <value, weight> (non-empty, no negative weights)
random — random number generator
-
How can we improve this article?
-