

Applies to AnyLogic Cloud 2.8.1. Last modified on June 24, 2026.
When configuring the Outputs section, you can add or remove the output data elements and freely position them within the Outputs area.
You can add the following elements:
- Outputs — charts and text labels that display the values of the model’s outputs.
- Collapsible sections which group the dashboard elements.
- Separating lines which divide the workspace into distinct areas.
To add an element, click the  button. To remove an element, click the
  icon in its upper right corner.
For more information about the different types of output and charts available in Cloud, see the appropriate section: Experiment charts.
To add a section
-
Click in the Add section placeholder. A section heading is created:

-
Type the section name in the text box:

-
The section is initially empty. Add outputs to the section by dragging them under the section header:
Alternatively, you can drag the section header itself using the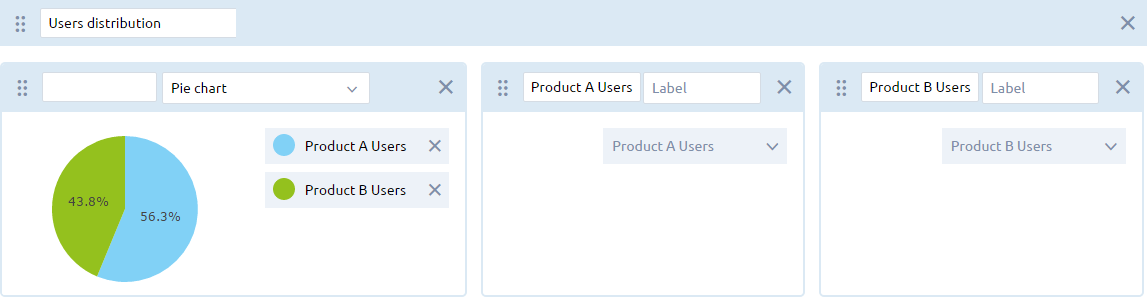
 drag handle on its left edge. Position the section above the outputs you want to include in it.
The section header marks the beginning of the section. All elements located below the header are included in the section. The section does not end until the beginning of a new section.
To visually divide the workspace into distinct areas, you can add a horizontal line between the output elements.
To add a separating line
- Click the
 button. The separating line will appear in the workspace.
 - Position the line as needed by dragging it with the handle on its left edge.
-
How can we improve this article?
-