

Polyline is a presentation shape that you can use to draw presentations for your models.
Using the polyline, you can draw triangles and polygons. Just draw the shape corners with the polyline points, then select the polyline’s option Closed, and optionally change its Fill color.
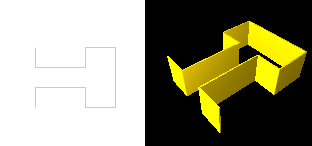
Polyline may appear in 3D animation, with a specified height. In this case the shape will be displayed at model runtime in the regular presentation, and also in 3D window (see the figure below). The base of the shape is drawn in the graphical editor, while its height is specified in the Z-Height property of the shape.
To draw a polyline
- Double-click the
 Polyline element in the
  Presentation palette.
 - The icon of the element should turn into
 . It means that the drawing mode is activated and now you can draw a polyline in the graphical editor point by point.
 - Click in the graphical editor at the position of the first point of the polyline.
- Subsequently click at other points where you want to place other salient points.
- Double-click to place the end point and finish drawing.
- To create a closed polyline you should not create its first and last points at the same position. Instead, you should check the Closed polyline checkbox in the Polyline points section of its Properties view. The last edge is then drawn automatically.
- In the Position and size section of the Properties view you can change the Z-coordinate of the polyline’s starting point (in the field Z) as well as the height of the polyline in the field Z-Height (by default it is set to 10).
- Optionally you can modify X, Y, Z coordinates of polyline points (relative to the coordinates of its starting point) in the Polyline Points properties section.
By default the shape is shown both in 2D animation and in your  3D window. You can set the shape to be shown only in 2D, or in 3D in the Show in advanced properties of the shape.
Each point of the polyline can be controlled during the model execution. You can specify dynamic expression, defining the number of points. The coordinates of the polyline’s points can also be defined by dynamic expressions.
- General
-
Name — The name of the shape. It is used to identify and access the shape from code.
Ignore — If selected, the shape is excluded from the model.
Visible on upper agent — If selected, the shape is also visible on the upper agent where this agent lives.
Icon — If selected, the shape is considered as a part of the agent’s icon. Please note that icon shapes are not shown in 3D animation.
Lock — If selected, the shape is locked. Locked shapes do not react to mouse clicks — it is impossible to select them in the graphical editor until you unlock them. It is frequently needed when you use a shape as a background image for your animation and you want to prevent editing this shape while drawing other shapes over it.
Visible — Here you specify whether the shape is visible on the animation at the model runtime, or not. Choose yes or no using the control, if you want to specify the visibility just once. Otherwise, if you expect visibility to change dynamically or to depend on some other conditions, you may specify the expression defining the shape’s visibility here. This expression will be dynamically re-evaluated at the model runtime. It should return boolean value. The shape is visible when the specified expression evaluates to true, and not visible otherwise.
- Appearance
-
Line color — The line color. Click the control and choose the required color using the Colors dialog box. Choose No Line, if you do not want the line to be drawn.
Fill color — Sets the polyline’s fill color. The polyline is painted in the following way: the line connecting polyline’s start and end points is drawn (if the polyline is not closed already) and the area inside the resulting shape is painted over.
Click the control and choose the required color using the Colors dialog box. Choose No Fill, if you do not want area inside the polyline to be filled.
Otherwise, specify here the expression defining the shape’s fill color.
The expression should return an instance of Java class Color. If it returns null, the shape is not filled.Line width — Choose the line width from the drop-down list, or enter the value in pixels in the field to the right. You can specify the dynamic expression, it should return int value.
Line style — [Enabled only if the 2D only option is selected in the Show in advanced property] The polyline style. Choose from the drop-down list, whether you want solid, dashed, or dotted line to be drawn.
- Position and size
-
Level — Level to which this element belongs.
X — X-coordinate of the polyline (its start point).
Y — Y-coordinate of the polyline (its start point).
Z — Z-coordinate of the polyline (its start point).
Z-Height — The z-height (height along the Z axis) of the polyline.
Rotation — Here you can specify the expression returning the shape’s rotation angle in XY plane.
Scale X — Here you can specify the expression returning the X-direction scale factor for the shape. *
Scale Y — Here you can specify the expression returning the Y-direction scale factor for the shape. *
Scale Z — Here you can specify the expression returning the Z-direction scale factor for the shape. *
* You can dynamically scale the shape at the model runtime by specifying expressions in the Scale X, Scale Y,and optionally Scale Z parameters. - Polyline points
-
The table located on the Points property page of the polyline enables users to view and adjust coordinates of polyline points.
Here you define relative coordinates, not the absolute ones. The first point of the polyline always has coordinates (0,0,0) that cannot be changed.
Other rows of the table define relative coordinates of the successive polyline points. Coordinates of each polyline point are actually offsets of the corresponding point from the polyline’s start point along X, Y and Z axes correspondingly.
While you can manage point coordinates in two-dimensional XY space graphically right on the presentation diagram, the location of polyline points regarding Z-axis can be adjusted only here, in this coordinates table.Number of points — Here you can specify the expression that will dynamically re-evaluate the number of points of the polyline.
dX[indexPt] — Here you can specify the expression for the X-offset of the polyline’s point with the index indexPt regarding the start point of the line. Use the predefined symbol indexPt to refer to the current point index. The index value is zero based, i.e., the first point has index of 0.
dY[indexPt] — Here you can specify the expression for the Y-offset of the polyline’s point with the index indexPt regarding the start point of the line. Use the predefined symbol indexPt to refer to the current point index. The index value is zero based, i.e., the first point has index of 0.
dZ[indexPt] — Here you can specify the expression for the Z-offset of the polyline’s point with the index indexPt regarding the start point of the line. Use the predefined symbol indexPt to refer to the current point index. The index value is zero based, i.e., the first point has index of 0.
Closed polyline — If selected, the polyline is closed, i.e. its begin and end point are connected with extra segment.
- Advanced
-
Show in — Here you can choose whether you want this shape to be shown both In 2D and 3D animation, or in 2D only, or in 3D only.
Replication — The replication factor of the shape. Here you specify how many copies of the shape will be created (the integer number). If you leave this field empty, only one shape will be created.
On click — Here you can type Java code that will be called each time a user clicks on the shape at the model runtime. If there are several shapes overlapping in the click point, the click will interact with the topmost shape only.
Local variables:
self — the element itself.
clickx — x-coordinate of the click relative to the shape coordinates.
clicky — y-coordinate of the click relative to the shape coordinates.Show name — If selected, the shape’s name will be displayed on the presentation diagram.
To move a point of a polyline
- Select the polyline with a click.
- Drag the polyline’s point.
To add a new salient point to a polyline
- Double-click on a segment of the polyline, where you want to add new salient point.
To remove a point of a polyline
- Double-click on the polyline’s point you want to remove.
To split a polyline into two polyline shapes
- Right-click the polyline and choose Split into Two Shapes from the popup menu.
- Click the polyline’s salient point where you want to split the shape into two individual shapes.
To append new segment(s) to a polyline
- Right-click the polyline and choose Append Line from the popup menu.
- Click one of two polyline’s end points to indicate where you want to append new segments to the polyline.
- Draw the new segments in the same way you draw the polyline.
To resize the shape
- Right-click the polyline and choose Edit shape from the popup menu.
- You will see the selection rectangle shown. Now you can resize the shape by dragging the required rectangle’s handles.
To rotate the shape
- Right-click the polyline and choose Edit shape from the popup menu.
- Drag the circular handle drawn above the shape’s centre clockwise or anticlockwise.
You can dynamically modify shape properties at model runtime using the following API.
- Location
-
Function Description double getX()
double getY()
double getZ()Returns the X (Y, Z) coordinate of the shape (polyline’s start point). void setX(double x)
void setY(double y)
void setZ(double z)Sets the X (Y, Z) coordinate of the shape (polyline’s start point). This function not just changes the coordinate of the polyline’s start point, but moves the polyline to the new location.
x — the new value of X coordinate.
y — the new value of Y coordinate.
z — the new value of Z coordinate.void setPos(double x, double y) Sets new coordinates for the shape (polyline’s start point). Z-coordinate is left unchanged. This function not just changes the coordinate of the polyline’s start point, but moves the polyline to the new location.
x — the new value of x coordinate.
y — the new value of y coordinate.void setPos(double x, double y, double z) Sets new coordinates for the shape (polyline’s start point). This function not just changes the coordinate of the polyline’s start point, but moves the polyline to the new location.
x — the new value of x coordinate.
y — the new value of y coordinate.
z — the new value of z coordinate. - Point coordinates, length
-
Function Description int getNPoints() Returns the number of points of the polyline. void setNPoints(int n) Sets the number of points in the shape. Does nothing if the number of points equals the current one. If it is different, the maximum possible set of points keep their coordinates in the new shape.
n — the new number of points.double getPointDx(int i)
double getPointDy(int i)
double getPointDz(int i)Returns the X (Y, Z) coordinate of a particular point of the shape relative to the start point.
i — the index of the point (starting from 0).void setPoint(int i, double ptdx, double ptdy) Sets the coordinates of a particular point of the shape relative to the start point. Z-coordinate is left unchanged.
i — the index of the point (starting from 0).
ptdx — the new X coordinate of the point relative to the start point.
ptdy — the new Y coordinate of the point relative to the start point.void setPoint(int i, double ptdx, double ptdy, double ptdz) Sets the coordinates of a particular point of the shape relative to the start point.
i — the index of the point (starting from 0).
ptdx — the new X coordinate of the point relative to the start point.
ptdy — the new Y coordinate of the point relative to the start point.
ptdz — the new Z coordinate of the point relative to the start point.void setPointDx(int i, double ptdx)
void setPointDy(int i, double ptdy)
void setPointDz(int i, double ptdz)Sets the X (Y, Z) coordinate of a particular point of the shape relative to the start point.
i — the index of the point (starting from 0).
ptdx — the new X coordinate of the point relative to the start point.
ptdy — the new Y coordinate of the point relative to the start point.
ptdz — the new Z coordinate of the point relative to the start point.boolean isClosed() Returns true, if the polyline is closed, and false otherwise. void setClosed(boolean closed) Sets the polyline closed or not.
closed — if true, the polyline set to be closed, if false — not.double length() Returns the length of the polyline. This method also respects z coordinates of points. - Z-height
-
Function Description double getZHeight() Returns the height of the shape along Z-axis. void setZHeight(double zHeight) Sets the height of the shape along Z-axis.
zHeight — the new value of z-height. - Scaling
-
Function Description double getScaleX()
double getScaleY()
double getScaleZ()Returns the scale of the shape along X (Y, Z) axis. void setScaleX(double sx)
void setScaleY(double sy)
void setScaleZ(double sz)Sets the scale of the shape along X (Y, Z) axis.
sx — the new value of scale along X axis. *
sy — the new value of scale along Y axis. *
sz — the new value of scale along Z axis. *
void setScale(double sx, double sy) Sets the scales of the shape along both axes.
sx — the new value of scale along X axis. *
sy — the new value of scale along Y axis. *void setScale(double s) Sets the same scale of the shape along both axes.
s — the new value of scale along both axis. ** The value 1 means that the original size should be kept. - Rotation
-
Function Description double getRotation() Returns the rotation of the shape in radians, clockwise. void setRotation(double r) Sets the rotation of the shape.
r — the new value of rotation in radians. - Visibility
-
Function Description boolean isVisible() Checks the visibility of the shape. If the shape is visible, returns true, otherwise returns false. void setVisible(boolean v) Sets the visibility of the shape.
v — visibility: if true — the shape is set to be visible, if false — not visible. - Draw mode (2D / 3D)
-
Function Description ShapeDrawMode getDrawMode() Returns the drawing mode of the shape (it defines where this shape is drawn: in 2D, 3D or 2D+3D animation).
Valid values:
SHAPE_DRAW_2D3D — show in 2D and 3D animation
SHAPE_DRAW_2D — show in 2D animation only
SHAPE_DRAW_3D — show in 3D animation onlyvoid setDrawMode(ShapeDrawMode drawMode) Sets the drawing mode of the shape (where to draw this shape: 2D, 3D or 2D+3D animation). This method may be called only once and only for the shapes created using the constructor without arguments. The call, which changes the set draw mode, will throw the error.drawMode — the new draw mode of the shape.
Valid values:
SHAPE_DRAW_2D3D — show in 2D and 3D animation
SHAPE_DRAW_2D — show in 2D animation only
SHAPE_DRAW_3D — show in 3D animation only - Group
-
Function Description ShapeGroup getGroup() Returns the group containing this shape. - Level
-
Function Description Level getLevel() Returns the level, where this shape is located. - Fill color
-
Function Description Color getFillColor() Returns the fill color of the shape, or null if shape has no fill color or has textured fill (in this case getFillTexture() should be used instead). Texture getFillTexture() Returns the fill texture of the shape, if the shape has fill texture. void setFillColor(Color fillColor) Sets the fill color of the shape.
fillColor — the new fill color, if null, the shape is not filled.void setFillColor(Object fillColor) Sets the fill color (or Texture) of the shape.
fillColor — the new fill color, if null, the shape is not filled. - Bounding rectangle coordinates
-
Function Description double getXMax() Returns the X coordinate of the bottom right corner of bounding rectangle for this polyline. double getXMin() Returns the X coordinate of the top left corner of bounding rectangle for this polyline. double getYMax() Returns the Y coordinate of the bottom right corner of bounding rectangle for this polyline. double getYMin() Returns the Y coordinate of the top left corner of bounding rectangle for this polyline. - Line appearance
-
Function Description Color getColor() Returns the color of the line, or null if the line has no color or has texture (in this case getTexture() should be used instead). Texture getTexture() Returns the line texture, if the line has texture. void setColor(Color color) Sets the line color.
color — the new line color, if null, the line is not drawn.void setColor(Object color) Sets the color (or Texture) of the line.
color — the new color, assign null to not draw the line.double getLineWidth() Returns the width of the line. void setLineWidth(double width) Sets the width of the line, 0 means thinnest possible.
width — the new width of the line.int getLineStyle() Returns the style of the line.
Valid values:
LINE_STYLE_SOLID — solid line.
LINE_STYLE_DOTTED — dotted line.
LINE_STYLE_DASHED — dashed linevoid setLineStyle(int style) Sets the style of the line.
style — the new style of the line.
Valid values:
LINE_STYLE_SOLID — solid line.
LINE_STYLE_DOTTED — dotted line.
LINE_STYLE_DASHED — dashed line.
- Points on the polyline (or inside the closed polyline)
-
Function Description boolean contains(double px, double py) Tests if the polygon (based on this polyline points) contains the point with coordinates (x,y). (relative to this shape’s container, i.e. in the same system with the coordinates of this shape, x and y) Returns true if the shape contains the point with the given coordinates.
px — the x coordinate relative to this shape’s container.
py — the y coordinate relative to this shape’s container.Point randomPointInside() Returns the randomly chosen point inside the shape area.
This function utilizes Random Number Generator of the Presentable object containing this shape. (Will throw an exception if the shape has been created from code and has not been added to any group, — in this case use randomPointInside(Random rng)).
Returns null if the polyline has no points.Point randomPointInside(java.util.Random rng) Returns the randomly chosen point inside the shape area. This function utilizes the given Random Number Generator.
rng — the random number generator.
-
How can we improve this article?
-