Applies to AnyLogic Cloud 2.7.0. Last modified on February 13, 2026.
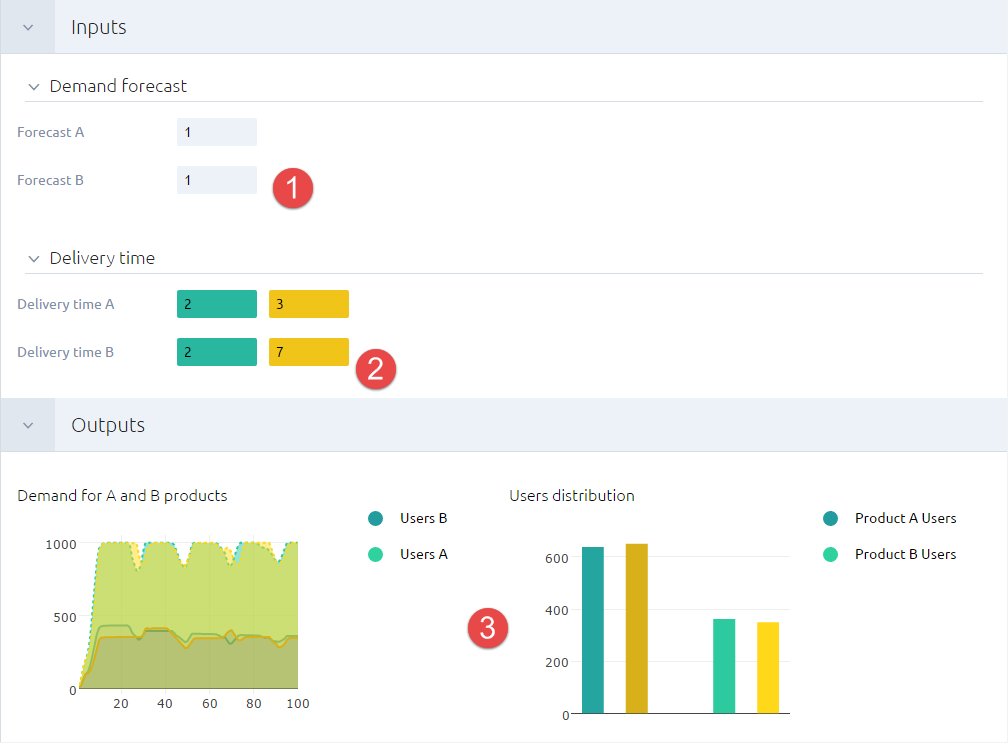
After running several experiments, you can visually compare the obtained results via the dedicated Comparison screen:

The screen looks similar to the experiment dashboard, but shows the inputs and outputs of several experiments simultaneously:
- The coinciding input values of the compared experiments are displayed in grey.
- The differing input values of the compared experiments are displayed in color.
- The output values are displayed in the Outputs section.
The displayed set of outputs is defined by the corresponding set of the first experiment that was added to the comparison.
To compare several experiment results
-
Click the
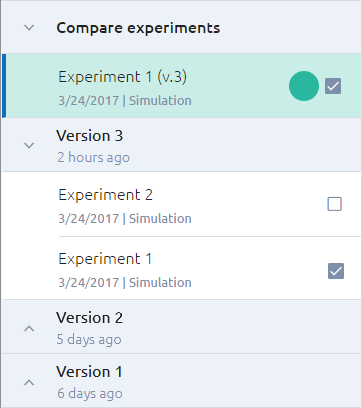
 Compare button in the experiment toolbar. The Comparison screen will open up and the selected experiment will appear in the Compare experiments section of the sidebar:

-
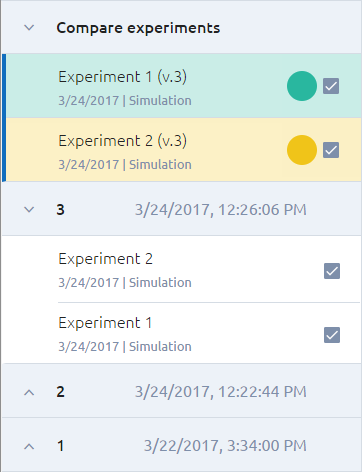
To include another experiment to the comparison, select the checkbox
next to the experiment’s name. The experiment will be added to the Compare experiments section (to exclude an experiment from comparison, clear the checkbox next to the experiment’s name):

-
You can now visually compare the experiments’ results in the dashboard.
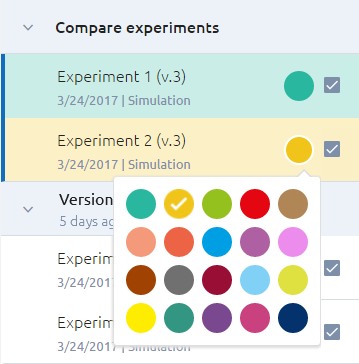
To customize the colors used for displaying the experiment’s results,
click the colored circle next to the name of the experiment, and select
the desired color from the drop-down menu:

To exit comparison
- Click the Exit Comparison button in the experiment toolbar.
-
How can we improve this article?
-

