

Starting from version 8.9.6, AnyLogic provides a simple interface for building charts, the chart creation wizard. This is a tool that helps you build charts for blocks and space markup elements collecting data.
The wizard displays a list of statistics gathered by the selected element and provides a range of relevant charts with data items already identified so syntax errors are avoided. You can select the statistics you want to display, the chart type and the metrics that should be displayed.
To create a chart using the wizard
Let’s use the Call Center model as an example.
Demo model: Call Center Open the model page in AnyLogic Cloud. There you can run the model or download it (by clicking Model source files). Demo model: Call CenterOpen the model in your AnyLogic desktop installation.- Here we will work with a Service block from the Process Modeling Library named service1. You can find it in the Projects view (Main > Agents > service1). Right-click the block on the graphical diagram and select Create Chart… from the context menu. The Chart creation wizard will appear.
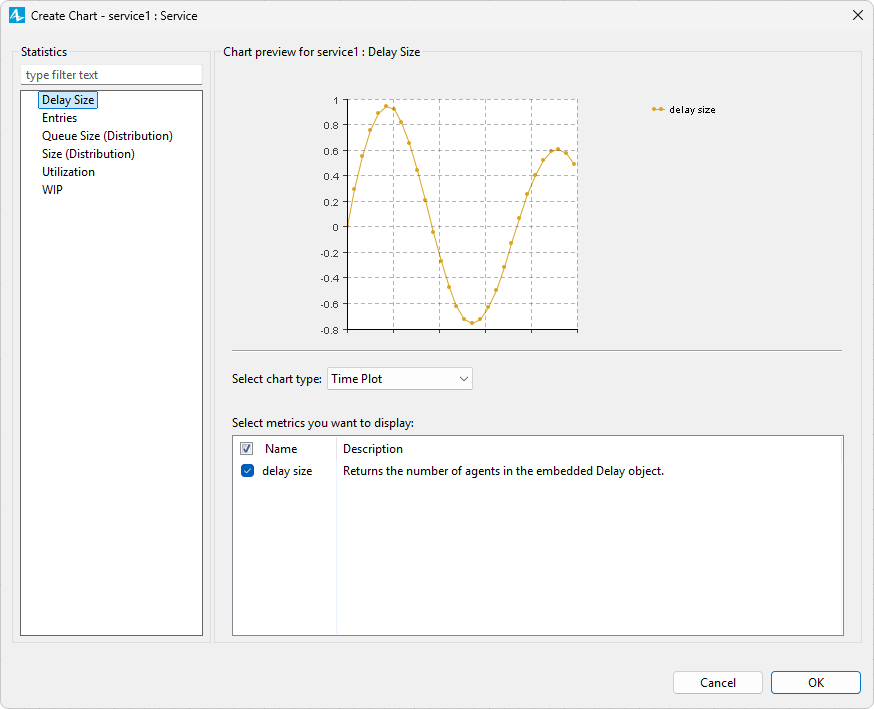
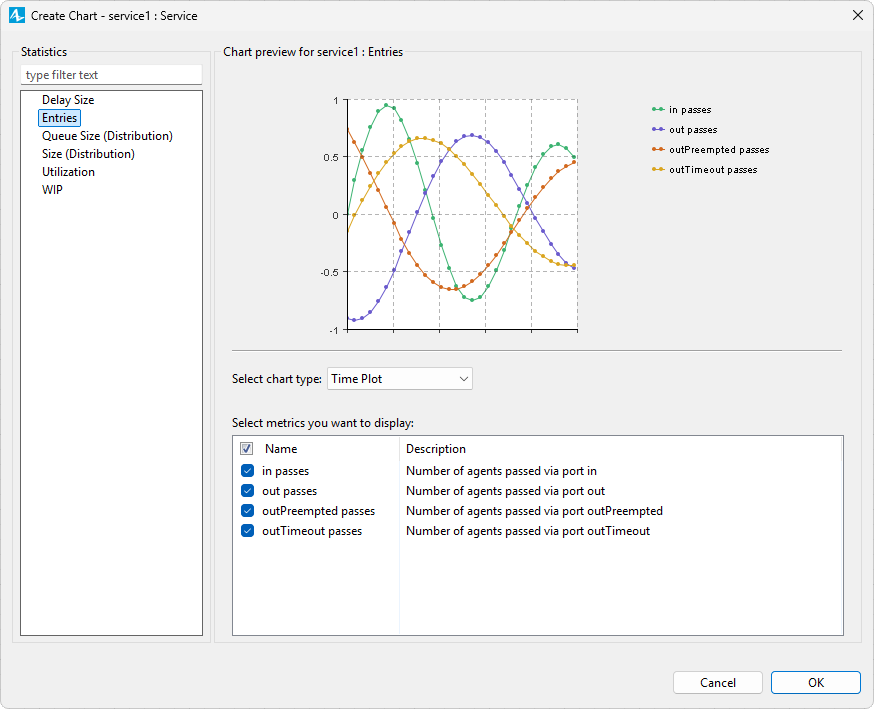
- Select an item from the Statistics list on the left. You will see a preview of your chart.
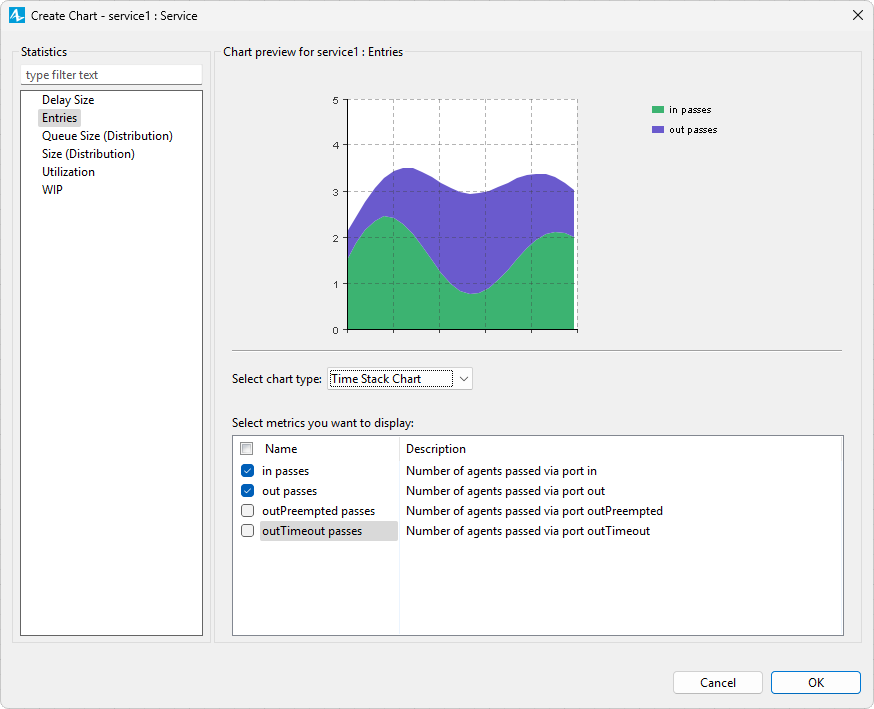
- Select the type of your chart in the drop-down list under the preview, then select the metrics you want to use in the list below and click OK.
After creation, you can go to the chart’s Properties view to edit its appearance or add more data items. Depending on the type of your chart, available settings may vary. When you are finished, you can use your chart just like any other AnyLogic chart. To learn more, open the Charts section of the AnyLogic help.
Depending on the selected element, the Chart creation wizard will suggest element-specific statistics. Here are some examples:
- Entries — [For blocks with ports] The number of agents that passed via a port.
- States — [For elements that go through operational states] The time an element spent in a certain state.
- Utilization — [For elements that can be used or operated] The workload volume calculated as one of the following:
- the fraction of time an element was operating,
- the mean of utilization values for several elements,
- the ratio of occupied cells or stored agents to capacity.
- MTBF — The mean time between element failures (in model time units).
- MTTR — The mean time it takes to repair an element or elements (in model time units).
- WIP — [For elements that process agents over time] The number of items in a phase that can be described as “work in progress”: active, busy, processed, in queue to use the agent, or idle. If there is more than one metric, several distribution histogram templates become available.
You can see descriptions for these and other templates in the wizard when selecting metrics for your chart.


-
How can we improve this article?
-