Applies to AnyLogic Cloud 2.7.0. Last modified on February 04, 2026.
The Completed runs view displays the results of all runs of a particular model in a table view.
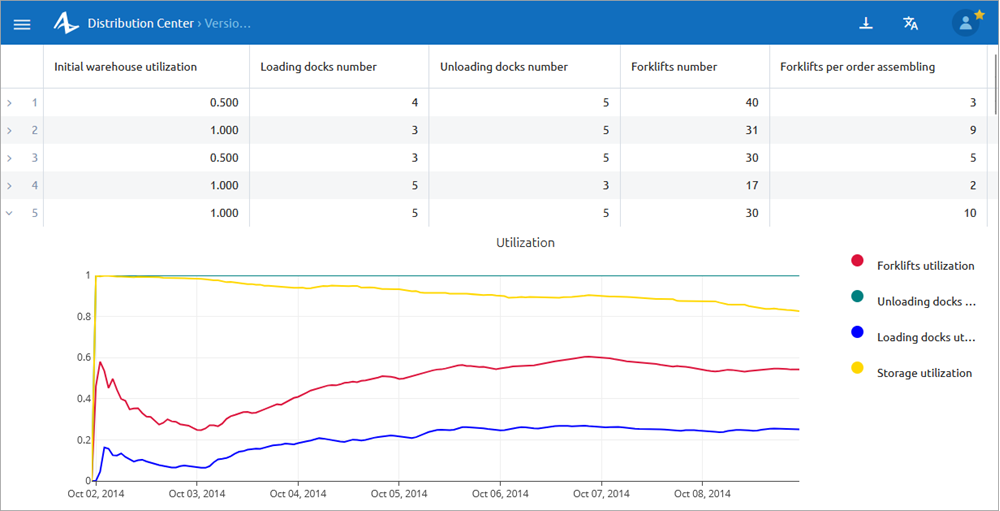
This article explains how to work with the table and configure the view. For a general description and quick reference to the elements, see the About section.
By default, the completed runs table shows all runs for a particular version of the model in a chronological order, and each column of the table shows the resulting value for a particular output element. There are several ways to customize the listing.
To sort the runs by a particular value
Sorting is available for string, integer, double, boolean, and date values.
- Move the mouse pointer over the the name of the column that corresponds to the value by which you want to sort the list.
-
Click the column’s title. A single click sorts the table by that value in ascending order, and a double-click sorts it in descending order.

To filter the runs by a value
- Move the mouse pointer over the name of the column that corresponds to the value by which you want to filter the list.
- Click the
 filter icon that appears to the right.
 -
Based on the type of value, select the operator and enter the comparison value. The available operators are:
- Numerical: >, ≥, <, ≤ =, ≠
- Boolean: true, false, any
- Date: equals, before, after
- String: contains, equals
Charts of any kind are not supported for use in filtering.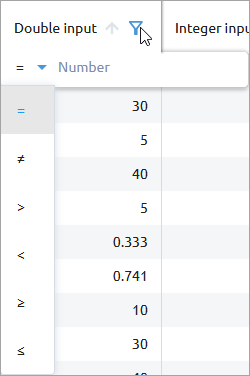
- Press Enter.
The table will be filtered according to the comparison results. The filter expression will be visible in the toolbar. Multiple filters are allowed, so you can provide multiple conditions to make your filter expression more complex. You can remove the conditions one by one by clicking the ![]() cross to the right of the condition, or remove them all away by clicking the
cross to the right of the condition, or remove them all away by clicking the ![]() cross icon to the right of the entire edit box to reset the view:
cross icon to the right of the entire edit box to reset the view:

The Completed runs view provides a variety of functions for in-depth analysis of individual run results:
-
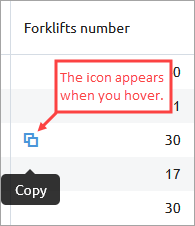
To copy a value from the table, move the mouse pointer over it and click the
 copy icon that appears to the side. The value is saved into the clipboard.
-
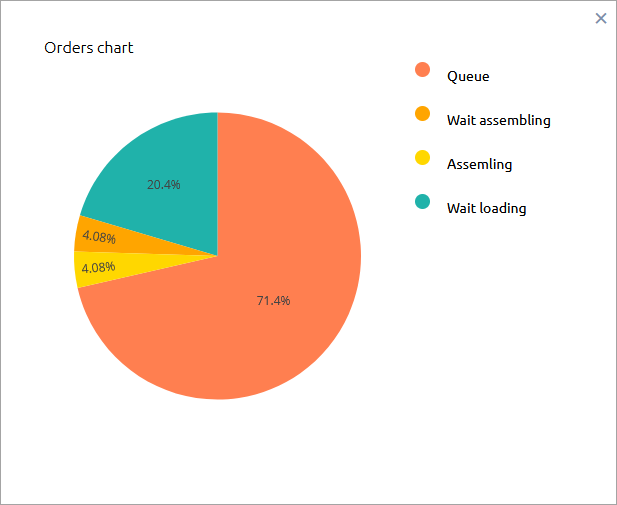
To view a chart, click the chart icon in a table cell.
The chart will open in a separate dialog box where you can view it in detail. It also provides standard chart navigation options with zooming, panning, and so on.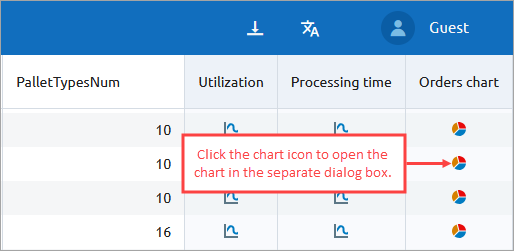
-
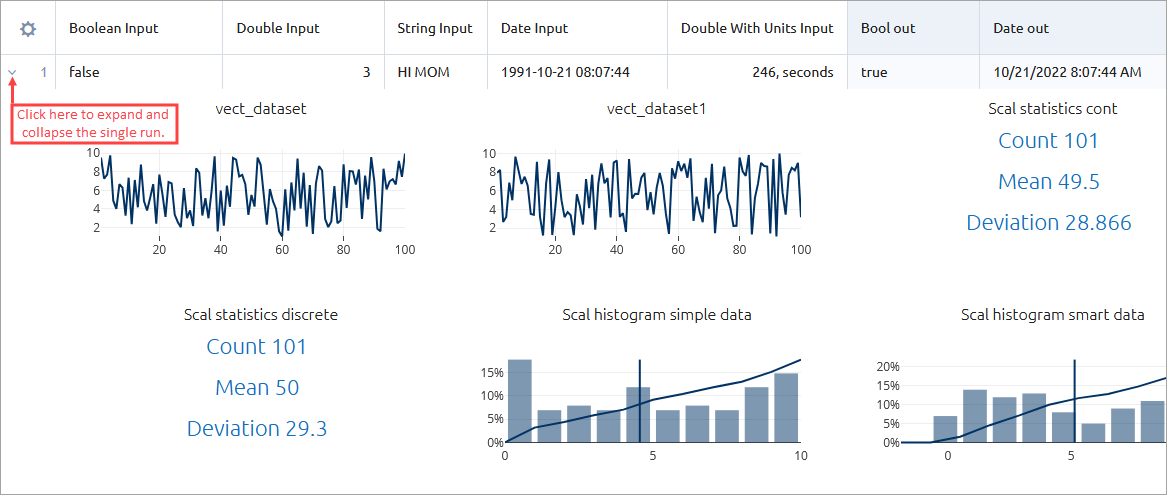
To expand the results of a single run, click the
 arrow icon to the left of that run’s row. This will open a read-only version of the experiment dashboard that contains all chart elements as configured, as well as data sets, statistics elements, and histograms. If the run does not contain any charts, it cannot be expanded.
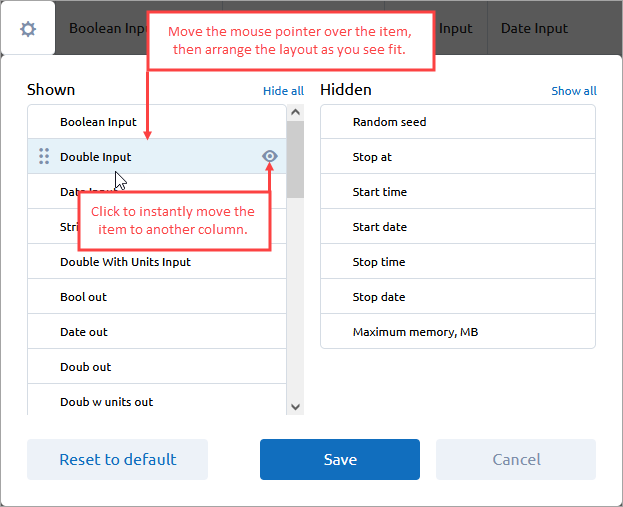
To configure the view, click the ![]() gear icon in the upper left corner of the table.
gear icon in the upper left corner of the table.
In the dialog that appears, the Shown column lists all the inputs and outputs that are currently displayed in the view. The Hidden column lists all the inputs and outputs that are currently hidden in the view. You can rearrange the items by dragging and dropping them, either to reorder them or to move them between columns.
-
To hide an individual element from the view, move the mouse pointer over it in the Shown column and click the
 eye icon that appears to the right.
Click Hide all at the top of the column to hide all items. -
To reveal an individual element in the view, move the mouse pointer over it in the Hidden column and click the
 eye icon that appears to the right.
Click Show all at the top of the column to show all items.
- Click Reset to default to return the view to its default state: with all inputs and outputs displayed as they appear in the experiment settings, and with only the default settings hidden from the view.
In the Completed Runs view, you can enable the Status column, which displays the results for each run. It is available for all runs stored in the instance, whether on Private Cloud or otherwise.
The column is hidden by default. You can toggle it or on off and reorder its display in the same way as any other column using the configuration menu.
When the column is enabled, runs with errors are displayed as follows:
- The row number is highlighted in red.
- The Status column displays the
 error icon.
 - All output columns display a dash (—) instead of values.
Expand the run to see the the error message, the time, and the model time when the error occurred.
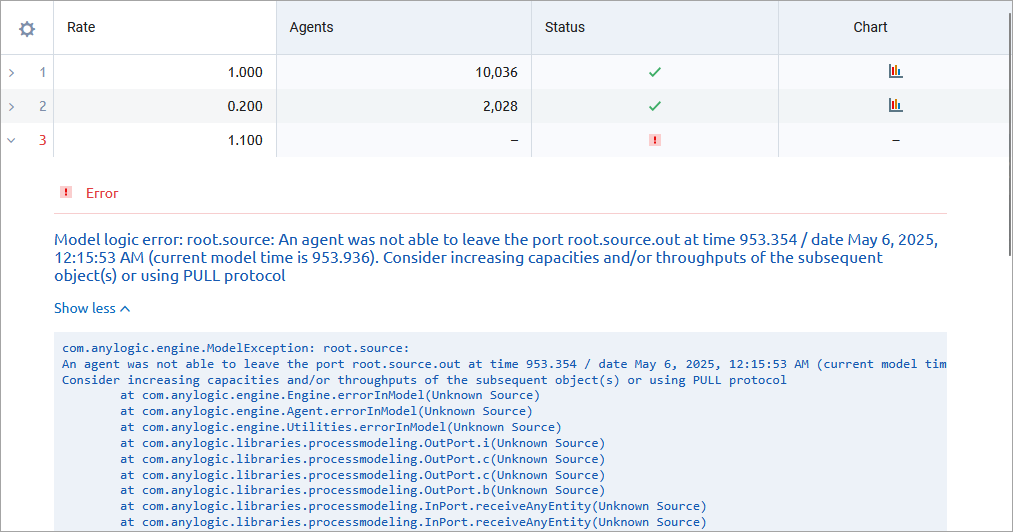
You can copy the error text and attach it to your support email in case you need assistance.
-
How can we improve this article?
-

