

First, we will create a simple model where we will simulate how to manufacture the electrodes, cover them with special paste, and collect them in batches.
Create a new model
- Click
 New toolbar button. The New Model dialog box appears.
 -
Specify the name of the model. In the Model name edit box, type Lead Acid Battery Production.
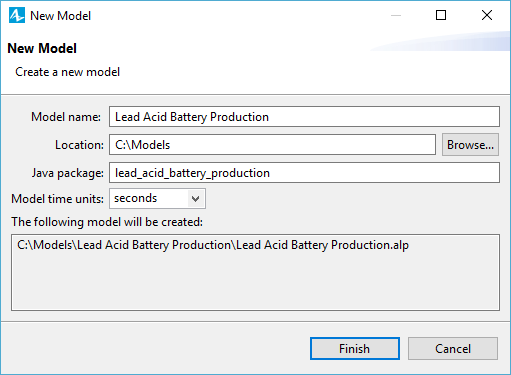
- Specify the location where you want to store your model files. Browse for the existing folder by clicking the Browse button or type the name of the folder you want to create in the Location edit box.
- Leave seconds selected as the Model time units.
- Click Finish to complete the process.
The new model is created. It already has one agent type called
![]() Main . This agent will serve as the place where we will define all the logic of the model: here we will draw the production line and define the battery manufacturing process using a flowchart.
Main . This agent will serve as the place where we will define all the logic of the model: here we will draw the production line and define the battery manufacturing process using a flowchart.
In the center of the workspace, you see the graphical editor. It shows the diagram of the
![]() Main agent.
Main agent.
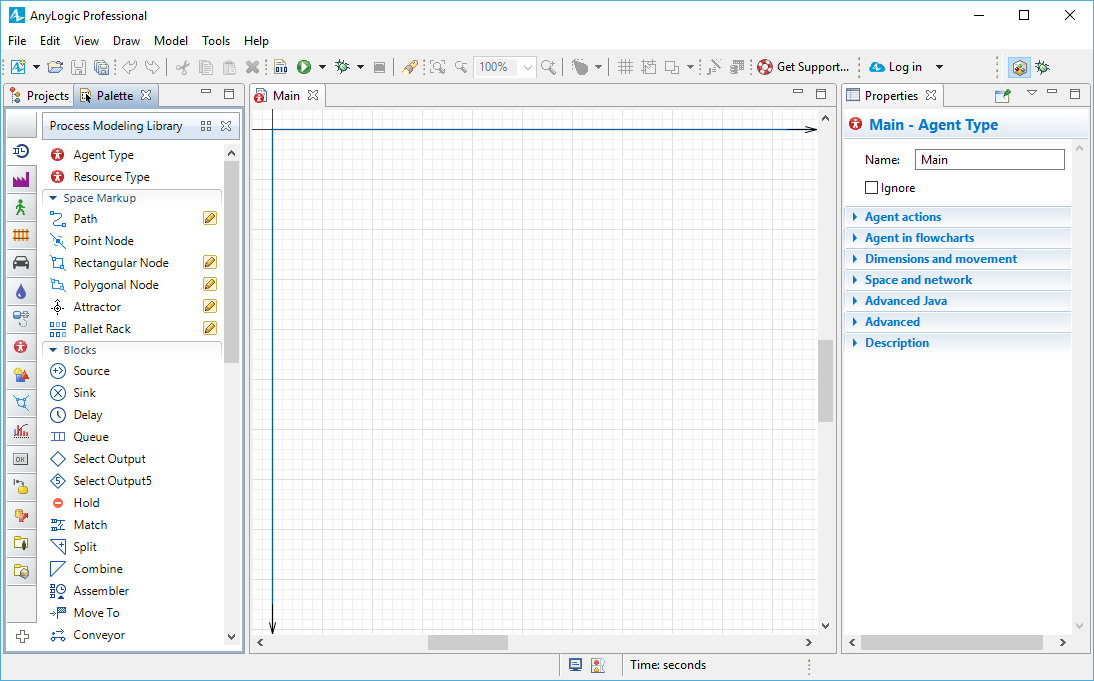
To the left of the graphical editor, you can see the
 Projects view and the
 Palette view sharing the same area. The
Projects view provides access to AnyLogic models currently opened in the workspace. The workspace tree provides easy navigation throughout the models. The
Palette view contains all graphical elements that you can add onto the graphical editor of your agent by simply dragging and dropping. The model elements are grouped by categories in a number of palettes.
Palette view sharing the same area. The
Projects view provides access to AnyLogic models currently opened in the workspace. The workspace tree provides easy navigation throughout the models. The
Palette view contains all graphical elements that you can add onto the graphical editor of your agent by simply dragging and dropping. The model elements are grouped by categories in a number of palettes.
On the right side of the workspace, you can see the
 Properties view. The
Properties view is used to view and modify the properties of a currently selected model element. When you select something in the
Projects view or in the graphical editor, the
Properties view displays the properties of the selected item.
Properties view. The
Properties view is used to view and modify the properties of a currently selected model element. When you select something in the
Projects view or in the graphical editor, the
Properties view displays the properties of the selected item.
Now we can start developing the model.
We will use the following layout:
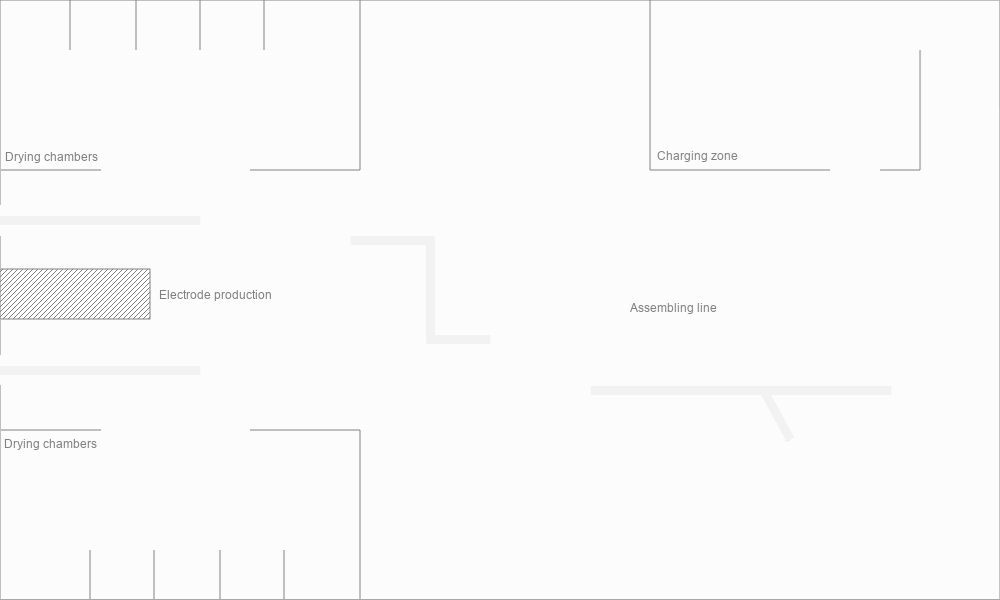
Save the layout image to your computer
- Right-click the image above, click Save picture as, and select the model folder as the location for the file.
We can now add this image to our model’s canvas.
Place the layout on the canvas
- Drag the
 Image element from the
 Presentation palette on the graphical diagram. You can use the
Image element to add images in several graphic formats — including PNG, JPEG, GIF, and BMP — to your presentation.
Presentation palette on the graphical diagram. You can use the
Image element to add images in several graphic formats — including PNG, JPEG, GIF, and BMP — to your presentation. -
Choose the image file to be displayed by this shape. The file browser will open automatically. Browse to the model folder where you just saved the layout image file, select it, and click Open in the dialog box. You will see the drawing displayed in the graphical editor.
Alternatively, drag the image directly from the folder and drop in on the graphical editor. -
Make sure the top left corner of the image is aligned with the axis origin.
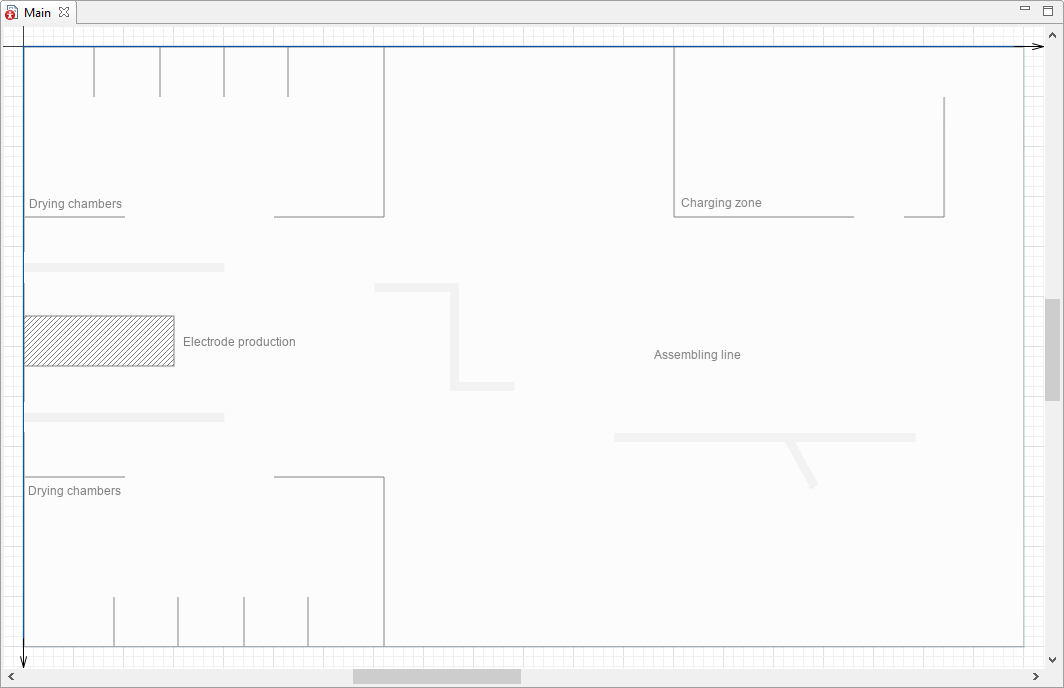
- In the Properties view, select the Lock check box to lock the image.
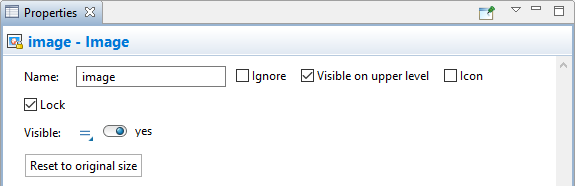
- You can lock a shape to ensure it does not respond to mouse clicks and cannot be selected in the graphical editor. This will prove helpful as you start to draw shapes on top of the layout.
- If you need to unlock the shape, right-click in the graphical editor and select Unlock all shapes from the menu.
- To unlock a particular shape, go to the model hierarchical tree in the
Projects view, find the shape in the Presentation group of the agent where the shape is located, click on it, and clear the Lock check box in its properties.
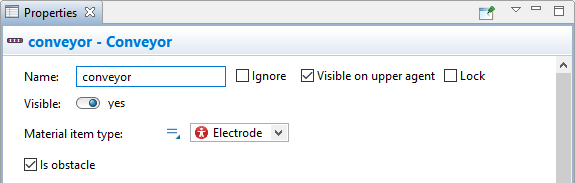
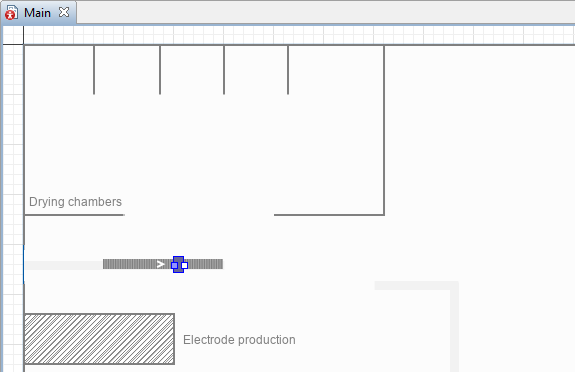
Our next step is to draw the conveyor that transports the electrodes from the point of their creation to the pasting machine and then to the storage location, using the space markup elements.
The Material Handling Library markup is not only a set of instruments to define the layout of the model. Such elements as
 Conveyor,
 Station,
 Jib Crane also serve to define the logic of the model: the speed of material item movement, use of resources, and so on.
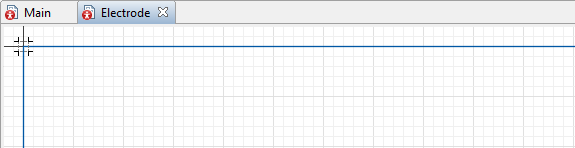
Draw the conveyor
-
Open the
 Space Markup palette. In the Material Handling section, double-click the
Conveyor element to activate its drawing mode. The icon of the element will change to
Space Markup palette. In the Material Handling section, double-click the
Conveyor element to activate its drawing mode. The icon of the element will change to  .
.
-
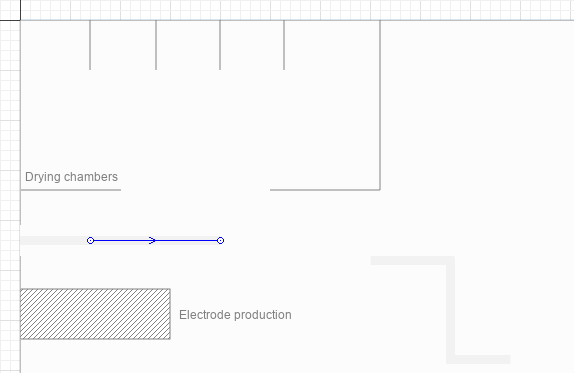
Draw the conveyor as displayed in the figure below by clicking the graphical diagram once to place the starting point of the conveyor and then double-clicking to place its ending point. Note that the direction of the conveyor movement will follow the placement of these points.
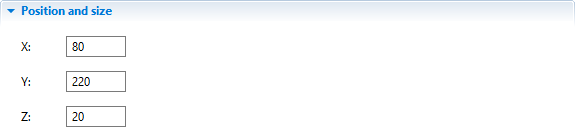
- In the Position and size section of conveyor’s Properties, specify Z: 20.
Congratulations! We have finished drawing the first element of our production line. Now, let’s build the flowchart to define the model logic behind this step.
This flowchart will be composed from the
 Process Modeling Library and
 Material Handling Library blocks. Each block will define an operation performed on the electrodes in the course of production.
In AnyLogic, you can create flowcharts by adding the blocks from the library palette to the graphical diagram, connecting the blocks to each other in the necessary order, and tuning their parameters according to your modeling needs.
Create the model flowchart
-
Drag the
 Source block from the
Process Modeling Library palette to the
Source block from the
Process Modeling Library palette to the
 Main diagram. We will use it to generate electrodes.
Place the block below the layout and leave some space between them, since the flowchart will expand with each step of the tutorial not only vertically but also horizontally, and you want to leave enough space to fit all the blocks.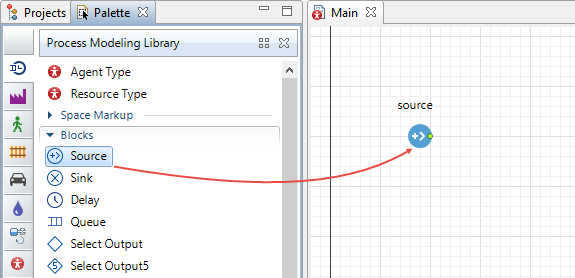
-
In the
Source block’s Properties configure the parameters as shown in the figure below to make sure that the block will generate 200 electrodes every 1.5 hour and the electrodes will exit the block smoothly one by one:
- Arrivals defined by: Interarrival time
- Interarrival time: 1.5 hours.
- First arrival occurs: At model start.
- Select the Multiple agents per arrival check box.
- Agents per arrival: 200
-
In the Agent section of the properties:
- Clear the Forced pushing check box.
- Agents that can't exit: wait in this block.
-
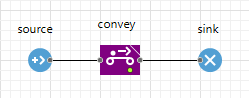
To model the transfer of the electrodes by the conveyor, drag the
 Convey block from the
Material Handling Library palette to the
Main graphical diagram and place it next to the
Source block so that they are automatically connected as displayed in the image below:
Convey block from the
Material Handling Library palette to the
Main graphical diagram and place it next to the
Source block so that they are automatically connected as displayed in the image below:
This is the only block of the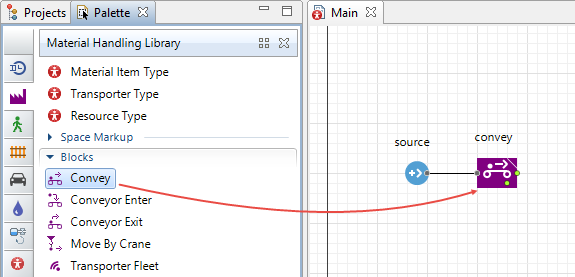 Material Handling Library that controls the movement of the material items in the conveyor network. By default, it selects the shortest route from the starting point to the destination, but you can also specify the precise sequence of conveyors which should make up the route or use Avoid conveyors and Include conveyors options to customize it.
-
In the convey block’s Properties, specify the Source conveyor: conveyor and Target conveyor: conveyor.
There are two ways to refer to model elements from the block’s parameters:- Select a graphical element from the list of available and valid elements displayed next to the parameter:
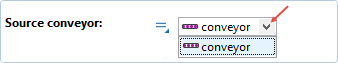
- Select a graphical element by clicking the selection button located next to the list. The available and valid elements will be highlighted in the graphical editor and you can select the intended element by simply clicking it:
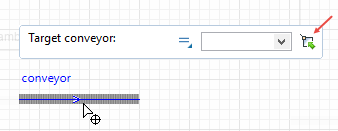
- Select a graphical element from the list of available and valid elements displayed next to the parameter:
-
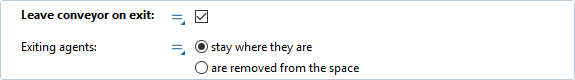
Next, select the Leave conveyor on exit check box.
- Add a
 Sink block. It disposes of agents and is usually the last block in the flowchart.
We have finished building a simple flowchart and now can run the model and see how the electrodes move along the conveyor.
Start the model
-
Click the
 Run toolbar button and select the experiment you want to run from the drop-down list. Your simulation experiment is called Lead Acid Battery Production / Simulation.
In our case, this model is the only one currently open in the workspace, so you will be prompted to run this particular experiment. Later on, pressing this button will start the previously launched experiment. To run any other experiment, right-click (macOS: Ctrl + click) the experiment in the
Projects view and select Run from the context menu.
On starting the model, you will see the presentation of your top-level agent type (by default, it is
![]() Main). The model will launch immediately. Observe the process dynamics. You will see how electrodes move along the conveyor in 2D animation over the layout image.
Main). The model will launch immediately. Observe the process dynamics. You will see how electrodes move along the conveyor in 2D animation over the layout image.
If needed, adjust the execution speed to your needs using the slow down  and speed up
  buttons.
You must have observed that the electrodes on the conveyor that we have just modeled did not look much like real electrodes. To correct this, we will create a new agent to represent them in our flowchart.
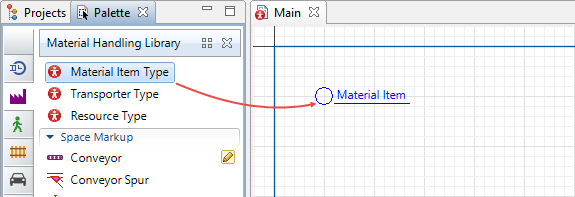
Create a new material item type
-
Drag the
Material Item Type element from the
Material Handling Library palette to the
Main graphical diagram.
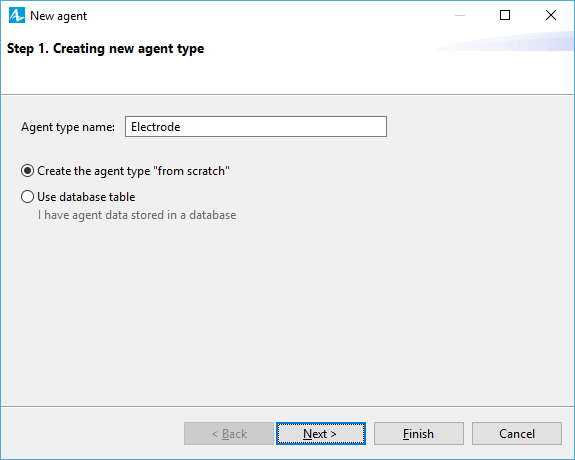
- The New agent wizard will appear automatically.
- On the first page of the wizard, specify the Agent type name: Electrode.
-
Click Next to proceed.
-
The next step offers to select the animation for the material item of this type. Since we will create the custom animation, select None and click Finish.
AnyLogic will automatically open the graphical diagram of the new agent type.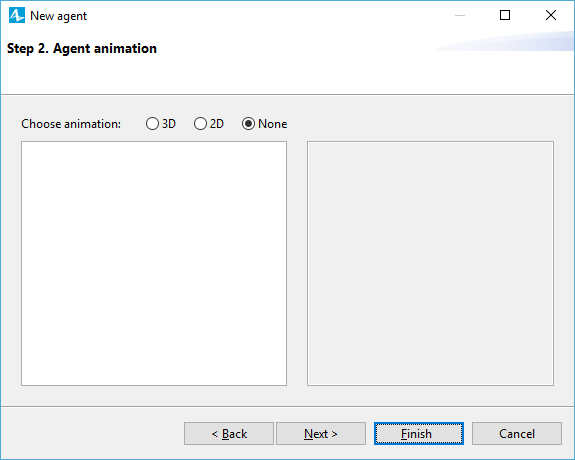
-
In the Properties view of the
Electrode agent, expand the Dimensions and movement section and change the length, width, and height of the
Electrode agent type according to the figure below.
The Properties view is context-sensitive: it always displays the properties of the currently selected item. You can select the item by clicking it either in the model tree (in the Projects view) or in the graphical editor.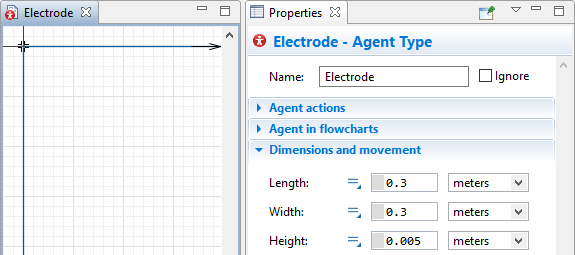
-
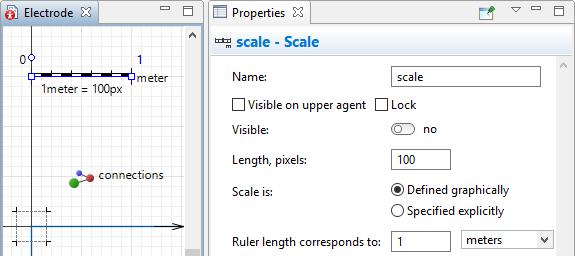
Now, let’s adjust the agent’s scale. Pan the canvas of the
Electrode agent graphical diagram down by clicking on the diagram and scrolling up until the Scale element comes into view. In the scale’s properties, set the Ruler length corresponds to: 1 meter. Note how the placeholder for the animation (located at the axis origin) has changed its size.
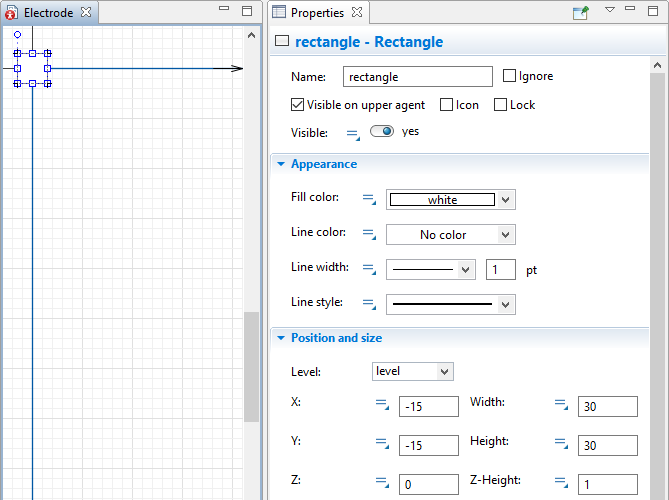
- Add the animation figure. Drag the
 Rectangle element from the
Presentation palette to the
Electrode graphical diagram and place it at the axis origin.
Rectangle element from the
Presentation palette to the
Electrode graphical diagram and place it at the axis origin. - In the Appearance section of the rectangle’s properties, leave the default Fill color unchanged.
- In the Line color drop-down menu, select No color.
-
In the Position and size section of the properties, adjust the settings as shown in the figure below. Now the size of the rectangle will fit the animation placeholder exactly.
Now that we have finished creating the new agent, let’s make some adjustments so that everything fits together properly.
Scaling elements
- Go to the
Main graphical diagram. Pan the canvas of the graphical diagram until the Scale element comes into view.
- In the scale element’s properties, specify the Ruler length corresponds to: 5 meters.
- In the properties of the conveyor, set the Width to 0.5 meter.
We have to let our markup element (conveyor) and the flowchart know that the material item is represented by the
![]() Electrode agent.
Electrode agent.
Specifying agent type
-
Open the conveyor properties and select
Electrode as the Material item type:
- In the flowchart, click the Source block.
- In the block’s properties, select
Electrode from the New agent drop-down list.
Run the model now and observe how the animation have changed.
The lead grates must be covered with a special paste that becomes an active material that plays an important role in the electrochemical reactions of the charging and discharging processes of the battery.
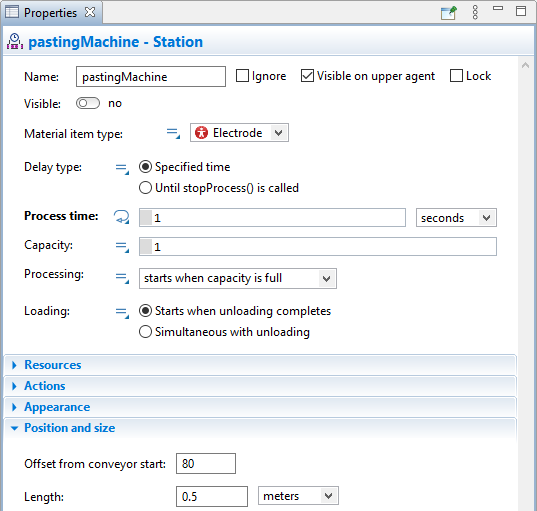
Add the pasting station
-
Drag the
Station element from the
Space Markup palette to the
Main graphical editor and place it on the conveyor we have drawn previously.
- In the station’s Properties, specify the following:
- Name: pastingMachine
- Process time: 1 second
- Offset from conveyor start: 80
- Length: 0.5 meter
After going through the pasting machine, the electrodes change color. To define this change during the animation, we will introduce a variable.
To set up dynamic change of color
- Switch to the
Electrode agent diagram by double-clicking it in the Projects view.
- Drag the
 Variable element from the
 Agent palette to the
Electrode graphical diagram.
Agent palette to the
Electrode graphical diagram. - Name it color.
- In the Properties view of the variable, specify the following:
- Type: Color
- Initial value: white
Here white is the name of a Java constant used to define the color.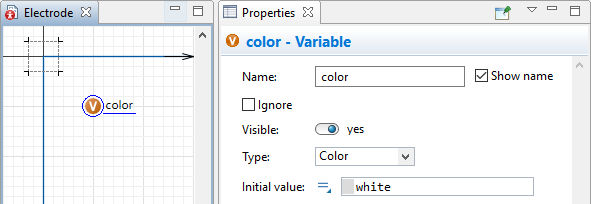 .
. -
Go to the Appearance section of the rectangle properties. We want to use the dynamic value for the shape’s Fill color that will allow our model to use the previously created color variable to determine the color of the electrode at runtime.
- Click the
 static property icon next to the Fill color field. After the icon changes to the
  dynamic property, a box will appear next to it.
 - Type color in this box to link this property to the previously created variable of the same name.
- Click the
-
Expand the Actions section of the
pastingMachine properties and type the following line of code in the On process finished field: agent.color = peru;
With the help of this code, we address each electrode (agent) that goes through the station and assign a new value (peru) to its color parameter at the moment when the station has just finished processing this agent (On process finished). When we run the model, we will see how the electrodes change their color after passing through the pasting machine.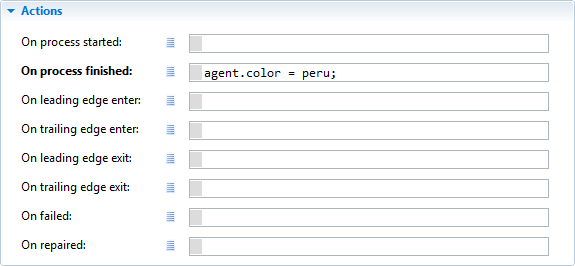
You can use the code completion wizard to simplify and streamline your work. Place the cursor where you want to enter the line of code, type the first letter of the word, and press Ctrl + Space (macOS: Cmd + Space). The wizard listing all the model variables and available functions will appear, and all the elements that begin with the letter you have typed will be listed at the top.
Double-click the necessary entry and the wizard will complete it for you.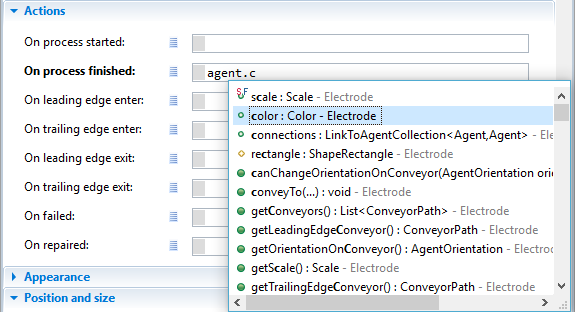
- Run the model and see how the grates change color after leaving the pasting station!
The electrodes must be collected into batches to be transferred to the curing oven. Let’s model this process.
Add the batch storage location
-
Double-click the
 Rectangular Node element in the
Space Markup palette to switch to the drawing mode. The icon of the element will change to
Rectangular Node element in the
Space Markup palette to switch to the drawing mode. The icon of the element will change to  . Click the
Main graphical diagram at the ending point of the conveyor to place the starting point (corner) of the node and move the mouse until the node obtains the intended shape. At this point, click the graphical editor again to finish the drawing. This is where the electrode batches will be stored before being transferred to the drying chamber.
. Click the
Main graphical diagram at the ending point of the conveyor to place the starting point (corner) of the node and move the mouse until the node obtains the intended shape. At this point, click the graphical editor again to finish the drawing. This is where the electrode batches will be stored before being transferred to the drying chamber.
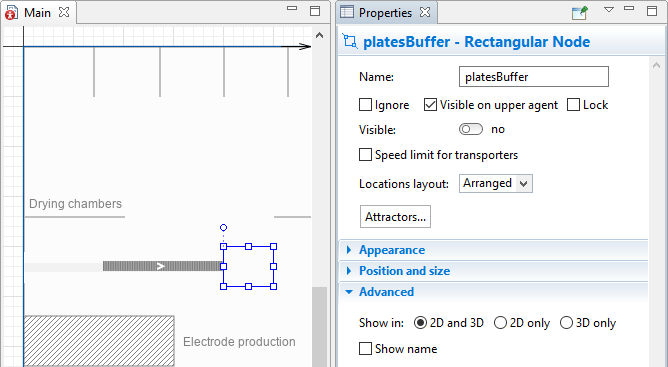
- In the Properties view, specify the following:
- Name: platesBuffer
- Location layout: arranged.
-
Expand the Advanced section of the node’s properties and select Show in: 2D only.
Add the batch block to the flowchart
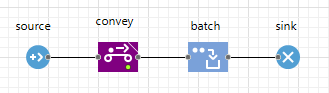
- Drag the Sink block to the right in order to free some space in the flowchart for the new block.
- Drag the
 Batch block from the
Process Modeling Library palette and place in on the flowchart before the sink block. The connection between blocks will be established automatically.
Batch block from the
Process Modeling Library palette and place in on the flowchart before the sink block. The connection between blocks will be established automatically.
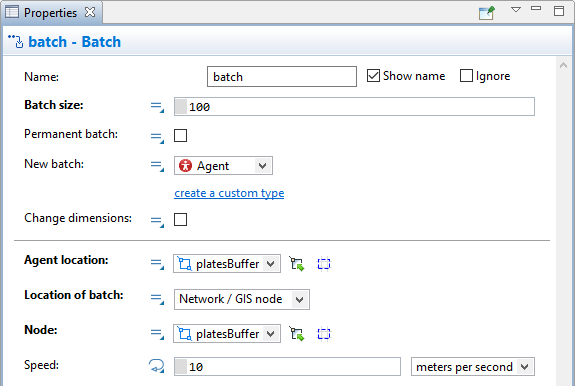
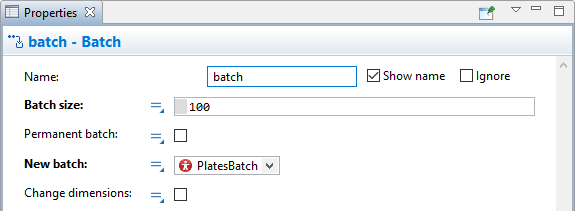
- In the Batch block’s Properties, make the following adjustments:
- Specify the Batch size: 100. The block will accumulate 100 agents of the
Electrode type before releasing them as a single batch.
- Agent location:
platesBuffer.
- Location of batch: Network/GIS node.
- Node:
platesBuffer.
- Specify the Batch size: 100. The block will accumulate 100 agents of the
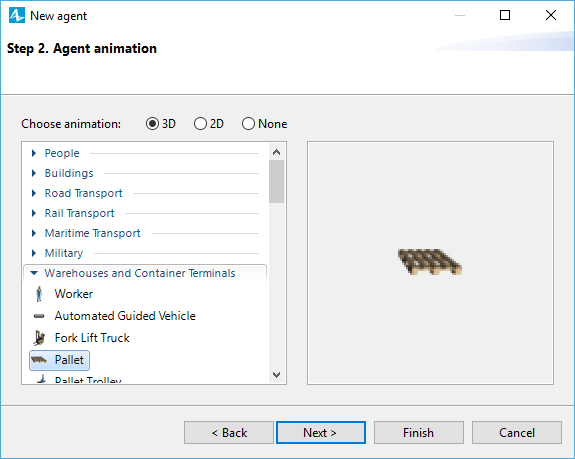
- Now, create a new material item type which will represent the electrode batches.
- Specify its Name: PlatesBatch.
-
In the New agent wizard, during Step 2. Agent animation, leave the 3D option selected, expand the Warehouse and Container Terminals section and select the Pallet element. Click Finish.
- In the
PlatesBatch properties, specify:
- Length: 1.2 meter
- Width: 1.2 meter
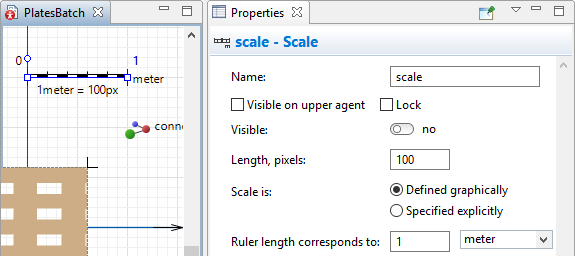
- Select the Scale element situated on the graphical editor of the
PlatesBatch agent.
- Specify the Ruler length corresponds to: 1 meter.
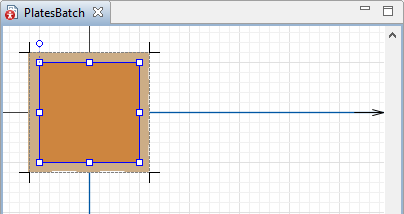
- Drag the
Rectangle element from the
Presentation palette to the
PlatesBatch graphical diagram. We will use this element to create the animation of the complete batch on the pallet.
- In the properties of the rectangle, specify the following:
- Fill color: peru
- Width: 100
- Height: 100
- Z-Height: 30
-
Place the rectangle over the pallet as shown in the figure below:
- Go back to the
Main agent graphical editor.
- Open the properties of the Batch block and select
PlatesBatch in the New batch parameter.
- Run the model again to see how the grates pass through the pasting machine, change color, and fill the storage area before disappearing.
Now that logic of the first phase is complete, let’s enhance our model with 3D animation.
The first step is placing the 3D window on the diagram of the agent type. The 3D window plays the role of a placeholder for the 3D animation. It defines the area on the presentation where the 3D animation will be displayed at runtime.
Add 3D window
- Drag the
 3D Window element from the 3D section of the
Presentation palette to the
Main graphical editor.
3D Window element from the 3D section of the
Presentation palette to the
Main graphical editor. - The grey area will appear. Place it where you want your 3D presentation to be displayed at the model runtime:
Now you can run your model and observe simple 3D animation.
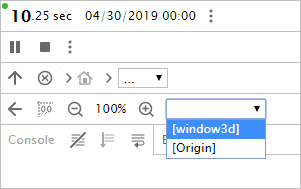
When you create a 3D window, AnyLogic adds a view area that allows you to easily navigate to the 3D view at runtime. To switch to this 3D view while the model is running, open the developer panel by clicking the Developer panel  control in the right corner of the control panel. In the developer panel, expand the
  select view area to navigate list and select [window3d] from the list.
You can navigate through the 3D scene using the commands described below:
| In order to | Use the mouse as described here |
|---|---|
| Move the scene | 1. Press the left mouse button in the 3D view and hold the mouse button pressed. 2. Move the mouse in the required direction. |
| Rotate the scene | 1. Press Alt key (macOS: Option key) and hold it pressed. 2. Click in the 3D scene window and, while holding Alt and the left mouse button down. 3. Move the mouse in the required rotation direction. |
| Zoom in or out the scene | 1. Scroll the mouse wheel in the 3D window away from or towards you. |
If you run the model now, you will see that the conveyor, electrodes, and batches are animated in 3D, but the pasting machine and the walls are absent. Let’s fix that.
Add the pasting station
- First, click the
pastingMachine element on the conveyor and in its properties switch the Visible option to no. This way the default animation of the station will not be displayed during the model run and will not interfere with the 3D animation figure.
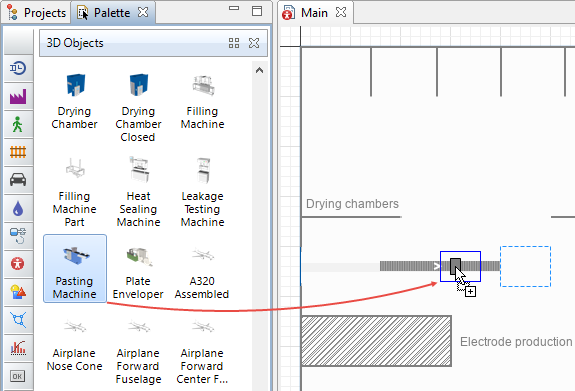
- Go to the
 3D Objects palette in the
Palette view.
3D Objects palette in the
Palette view. -
Drag the Pasting Machine 3D object from the Manufacturing section of the palette to the
Main graphical diagram and place it over the
pastingMachine.
AnyLogic will display the Auto scale 3D object dialog window. Since we have changed the default scale of the model, the scale of the 3D objects added from the palette should be adjusted accordingly to look natural on runtime. -
In the dialog window, click Yes.
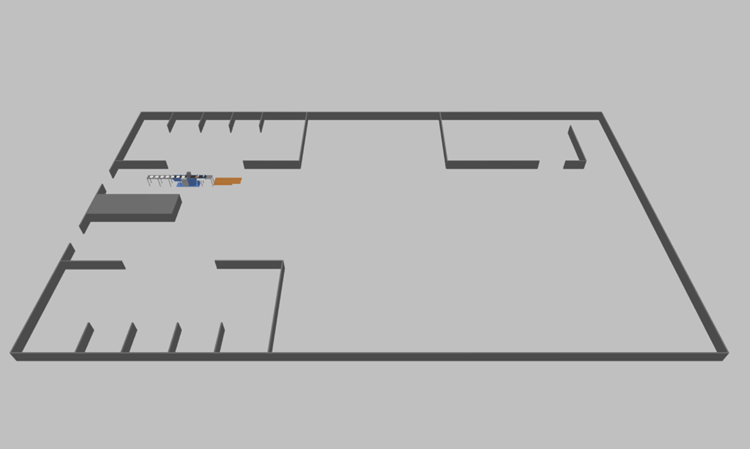
Draw the walls
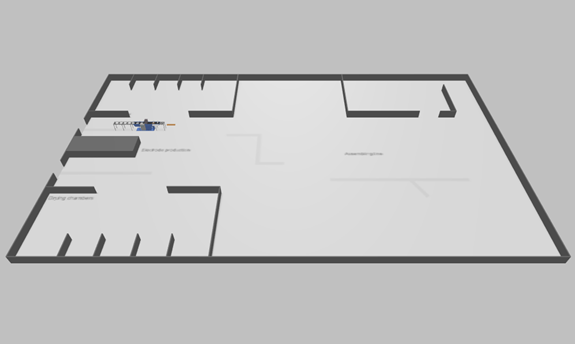
- Double-click the
 Wall element in the Pedestrian section of the
Space Markup palette to activate the drawing mode.
Wall element in the Pedestrian section of the
Space Markup palette to activate the drawing mode. -
Click at the point where the wall segment begins and place the next click at the corner of the wall. Double-click at the point where the wall segment ends.
There are several segments of the same size in the layout. Instead of drawing them one at a time, you can copy them. To do this, draw a single segment and then Ctrl + drag it to the intended place. Repeat the action as many times as necessary.
To adjust the placement of a segment, select it and use the Shift + arrow keys combination. - Use the
 Rectangular Wall element to draw the shaded rectangular area. The drawing principles of this element are the same as the
Rectangular Node.
Rectangular Wall element to draw the shaded rectangular area. The drawing principles of this element are the same as the
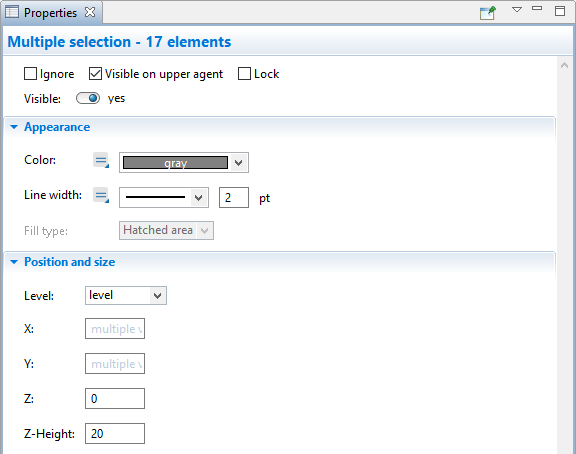
Rectangular Node. - Ctrl + click all the walls you have drawn and the properties view will display the Multiple selection.
- In the Appearance section, specify the Color: gray.
- In the Position and size section, specify the Z-Height: 20.
-
Run the model and view the 3D animation. As described above, open the developer panel by clicking the Developer panel button in the lower right corner of the control panel. In the developer panel, expand the select view area to navigate drop-down list and select [window3d]. If you need a quick refresher on navigating the 3D window, see the section above.
-
How can we improve this article?
-