

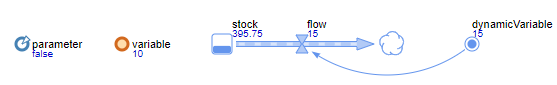
You can view current values of all parameters and variables at the model runtime (and optionally modify them, interactively affecting the model behavior).
At model runtime values of parameters and variables are displayed under their names (this requires the Show name option to be selected in properties of these parameters and variables).
You can view the history of parameter/variable values using more visual plots and charts.
AnyLogic provides two ways of viewing charts:
-
Using the inspection windows. Simply click the parameter or variable icon at model runtime to open the inspection window displaying the plot for this parameter or variable. Keep in mind that it is the simplest and effortless way to examine history of a parameter or variable during the model simulation, but it only can give you the general idea of the parameter or variable dynamics. To perform more sophisticated statistical analysis, use charts and analysis data objects from the Analysis palette (they are described below).
-
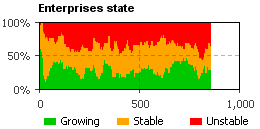
Using charts. AnyLogic provides the users with a set of fully functional charts that allow users to dynamically visualize data collected during the simulation. The collection of chart types is close to that of MS Excel: bar chart, stack chart, pie chart, plot, time plot, time stack chart, time color chart, histogram, histogram 2D.
AnyLogic supports various tools for collecting, displaying, and analyzing data during model execution. The simplest way to examine the current state and history of a parameter or a variable during model simulation is to use the inspection window.
To perform more sophisticated statistical analysis, use charts and data analysis elements from the Analysis palette (they are described below). They allow you to visualize variable trends using various charts and histograms, as well as calculate statistical information on collected data, such as the mean, minimum, and maximum values.
To view the plot of a parameter or variable in the inspection window
-
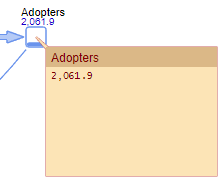
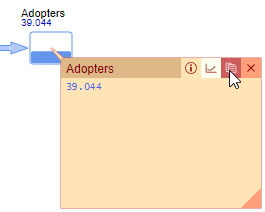
While running the model, click the parameter or variable icon in the model window. The light brown popup box, an inspection window, will be shown. The window has three modes: one for displaying the current value, another for modifying the value, and the last one for displaying the time plot for this parameter or variable. By default, the inspection window displays the current value of a parameter or variable.
-
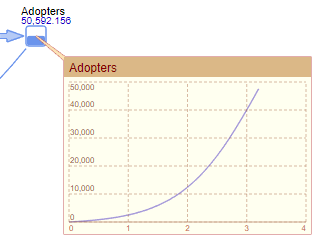
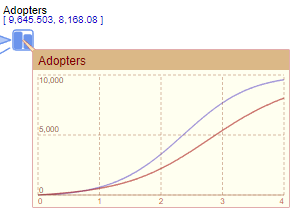
To switch to the plot mode, hover the mouse over the title of the inspection window and click the
 button there. You will see the plot displaying how the value of the parameter or variable have changed recently:
-
If your variable or parameter is an array, you will see several curves, each one corresponding to some particular element of this array:
-
Finally, to close the inspection window, hover the mouse over the inspection window and click the
 button in the top right corner of the inspection window.
The inspection plot is based on data collected from the data sets that are automatically created for the parameters and variables. New samples are added to these data sets at specified intervals. If the plot curves have breaks and are not smooth enough, it may mean that the data sets are not being updated frequently enough with new samples.
To change the update rate for data sets automatically created for variables
- Open the Advanced section of the properties of the agent type or experiment where your parameter or variable is located.
- Type the new value of the update period in Recurrence time.
- You can also specify here the maximum number of items that AnyLogic will store for every parameter and variable. Select the Limit the number of data samples option and specify the number in the up to the first ... items field.
You can export collected statistics to external applications that provide more comprehensive statistical analysis, such as Microsoft Excel.
To copy the data collected by the inspection window to the clipboard
-
Hover the mouse over the inspection window and click the
 button in the top right corner.
Now you can paste data from the clipboard.
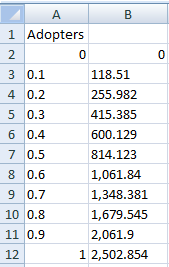
To paste data, for example, into Microsoft Excel, select the cell of the sheet where you want to start inserting values and press Shift + Insert. If you are copying values of one variable or parameter, data will be copied in two columns: the first will contain model time samples, while the second one will store the corresponding values of the variable or parameter in these time moments.
AnyLogic provides the users with a set of fully functional charts that allow users to dynamically visualize data collected during the simulation. The collection of chart types is close to that of MS Excel: bar chart, stack chart, pie chart, plot, time plot, time stack chart, time color chart, histogram, histogram 2D.
To add a chart displaying variable/parameter values
- Drag the required chart from the Analysis palette on the diagram of your agent type or experiment.
- Click the Add data item button in the Data section of the chart properties and enter the name of the corresponding parameter or variable in the field Value.
- In the same way you can add more data items to be displayed on the chart.
The history of parameter/variable samples collected for the chart can be exported to external applications providing more comprehensive statistical analysis (e.g. MS Excel).
To copy data collected by the chart to the Clipboard
- Right-click (macOS: Ctrl + click) the legend item corresponding to the data item whose history you want to copy and choose Copy selected from the context menu.
- If there are several data items on your diagram, you can copy history of all of them by choosing Copy all from the context menu.
Now you can paste the copied data in any external application.
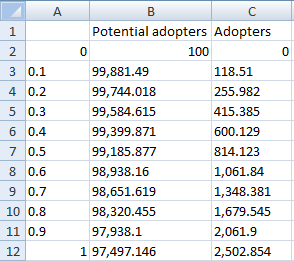
To paste data, for example, in MS Excel, you should select the cell of the sheet, where you want to start inserting values, and press Shift + Insert. If you are copying values of N variables, data will be copied in N 1 columns: the first column will contain model time samples, the second one — the corresponding values of the first variable in these time moments, the third one — values of the second variable and so on, see figure below.
-
How can we improve this article?
-