

AnyLogic models, which are essentially Java applications, benefit greatly from a programming-like approach to their design and optimization. Model profiling allows you to analyze and compare the performance of specific areas of the model code to improve its performance, locate sub-optimally designed code fragments, and avoid deadlocks.
Starting with version 8.9.4, AnyLogic includes a simple Java profiler that collects diagnostics and data about a running model. It is launched from the command line in parallel with the running model, ensuring no noticeable increase in memory consumption.
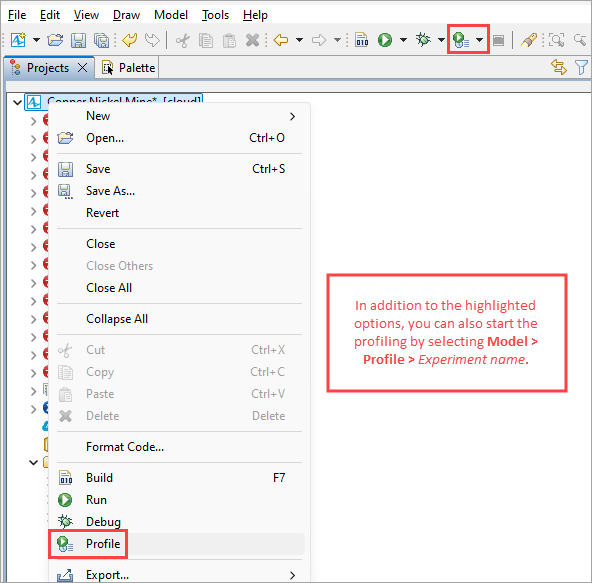
There are several ways to start the profiler: the model’s context menu, the main menu of AnyLogic, and the toolbar. Note that the profiler runs against a specific experiment, meaning that different experiments within the same model may exhibit different behavior during profiling.
To run the profiler
- Open the model.
- Right-click the model in the Projects view and select Profile > Experiment (for example, Simulation).
-
The model experiment starts as usual, with the profiler running in the background. To stop collecting data and open the view with the profiling results, you can:
- stop the model execution, or
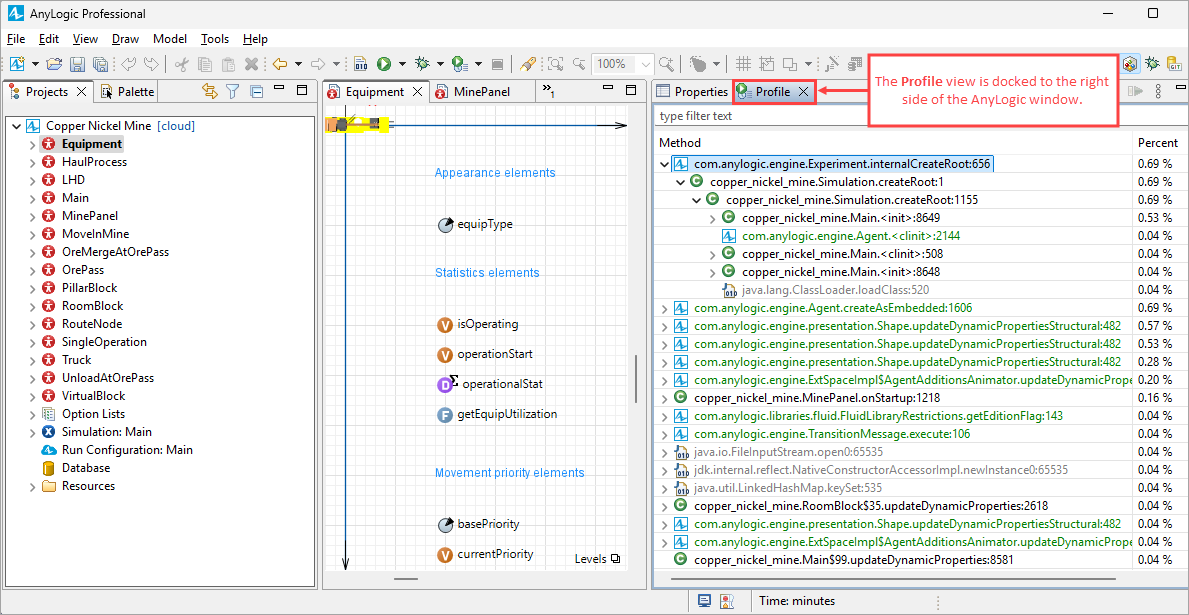
- switch to the new Profile view, on the right side of the AnyLogic window (same as with the Properties view) and click the Stop/Start profiling button there.
- When the profiling stops, you can go to the Profile view to analyze the results.
The Profile view displays the performance results of the last profiled experiment. Similar to the Properties view, it is docked to the right side of the AnyLogic window and is accessible from there most of the time.
To toggle the visibility of the Profile view, select View > Profile from the main menu of AnyLogic.
The view presents the profiling results as a tree of function calls. Each row shows the location of a function call in the model code and the percentage of the execution time spent on that function by the model.
Above the table are the filtering controls and the Stop/Start profiling button. This button is active only during profiling and is disabled at all other times. When profiling is in progress, you can click this button to stop profiling and view the results. Pressing it again restarts the profiling.
The table has the following columns:
-
Method — Displays the full name of the function, including its class and package name.
Double-click the entry in the column to navigate directly to the function in the model source code. Note that this is only supported for AnyLogic components, and methods executed by the Java environment cannot be located in this way. - Percent — Displays the percentage of the function’s execution time in the total execution time of the model.
- Relative percent — Displays the percentage of the function’s execution time relative to the total execution time of the currently filtered functions.
Consider the Copper Nickel Mine example model:
Demo model: Copper Nickel Mine Open the model page in AnyLogic Cloud. There you can run the model or download it (by clicking Model source files). Demo model: Copper Nickel MineOpen the model in your AnyLogic desktop installation.This is what the profiling results might look like for the simulation experiment in this model:
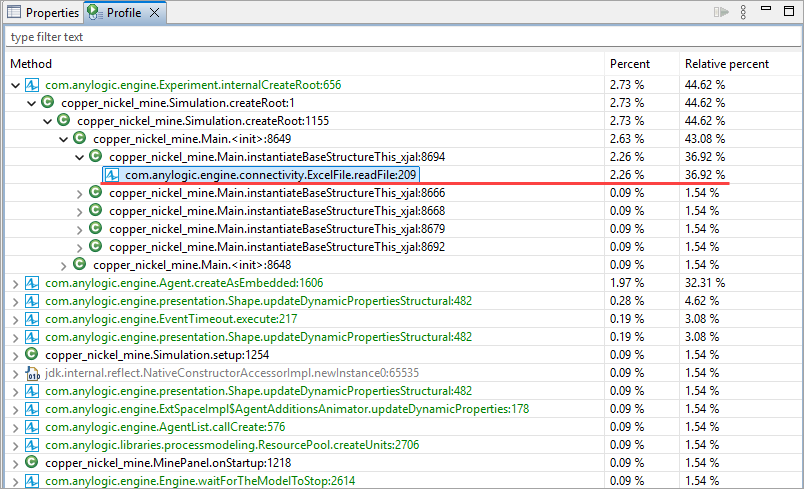
The figure shows that most of the experiment execution time is spent reading the Excel file containing the mine panel layout data.
In the percentage columns, if the percentage exceeds 50%, the cell is highlighted in yellow. If it exceeds 75%, the cell is highlighted in red.
You can filter the profiling results:
- Using the filter expression — Type your filter expression in the edit box above the tree view. The filter expression can match any part of the function name. The following wildcard characters are supported: * (matches multiple characters), ? (matches a single character).
-
Using the pre-built filters — Click
 View Menu in the top right corner of the view and select one of the available filters:
- Show AnyLogic libraries methods — Displays the methods implemented by AnyLogic libraries.
- Show obfuscated methods — Displays the obfuscated methods.
- Show JRE and external libraries Methods — Displays the methods of external libraries and the Java runtime environment (JRE).
The first two filters are primarily intended for scenarios that require assistance from the AnyLogic support team. We do not recommend attempting to analyze these functions manually.
-
How can we improve this article?
-