

System Dynamics element. Stock as well as flow is a fundamental element of a stock and flow diagram.
In System Dynamics stocks (also known as levels, accumulations, or state variables) are used to represent the real-world processes (e.g. stocks of material, knowledge, people, money). Stocks define static part of the system. Flows define how values of stocks change in time and thus define the dynamics of the system.
You can find more information on stocks and flows in Wikipedia.
Here are some examples of stocks and flows:
| Stock | Inflows | Outflows |
|---|---|---|
| bank balance |
deposits interest |
withdrawals |
| housing stock | housing investment | housing depreciation |
| CO2 in atmosphere | tons emitted | tons sequestered |
| population |
births immigration |
deaths emigration |
| fuel tank | refueling | fuel consumption |
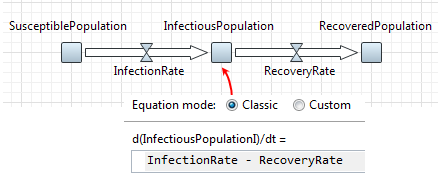
In AnyLogic, equations for stocks are constructed automatically from the graphical structure, and optionally can be typed manually. The default mode for stock equation is classic (automatic). In this mode, each incoming flow is added to the stock derivative expression, and each outgoing flow is subtracted. Therefore, the resulting equation is a linear combination of flows always conforming with the graphical structure.
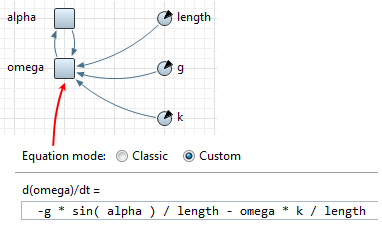
If you switch the radio button Equation mode in the stock properties to Custom mode, you will be able to manually type a freeform expression. The expression can then contain arbitrary arithmetic operations and function calls. This mode is used more frequently in dynamic (physical) systems models than in system dynamics.
The expression for stock derivative typed in custom mode is still checked for conformance with the graphics — namely, for each instance of a variable in the expression there should be an incoming link or flow from that variable to the stock, and vice versa.
Equations for flows and other variables are freeform. They are typed manually and checked for conformance with the graphical structure in the same manner. If discrepancy is detected, a problem item appears in the Problems view and a small red sign is displayed next to the equation. To view the error description, move the mouse cursor over the sign.
-
Drag the
 Stock
element from the
Stock
element from the  System Dynamics palette onto the graphical diagram of agent.

- Go to the Properties view.
- Specify the name of the stock in the Name edit box.
-
Specify the initial value of the stock in the Initial value property. You can type here some value, or a formula dealing with variables or parameters.
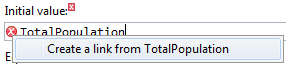
When you mention some elements in initial value, you should draw links from those elements to this stock first. There is however, link autocreation mechanism — you may just specify the formula — when finished typing, the error indicator will be shown to the left of the formula.
Click this indicator to show the popup menu with items offering you to create missing links from the mentioned elements to this stock. Choosing an item from the list you create the corresponding missing link. You can subsequently create all missing links in such an easy way: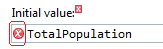
- By default the formula of the stock is generated automatically according to flows flowing and out of this stock. If anyhow you need to overcome the limitations of classic system dynamics formula of the stock and want to edit it by yourself by adding some variables and functions (e.g. this stock is used in a system of differential equations in dynamic system model), select the Custom option from the Equation mode group of buttons and specify the formula in the d(stock_name)/dt field.
- If this stock has multiple dimensions, make it an array as described in Defining equations for array variables and then initialize its elements.
- If you explicitly specify units of measurements for elements of your stock and flow diagram, do it for this stock. Go to the Advanced properties section and select the System dynamics units checkbox and type the unit name in the edit box (you can find more information on units and unit checking in Units.)
- If needed, you can resize the stock icon and change its fill color, see below.
- General properties
-
Name — The name of the stock. The name is used to identify and access the stock in formulas.
Show name — If selected, the name of the stock is displayed on the presentation.
Ignore — If selected, the stock is excluded from the model.
Visible on upper agent — If selected, the variable is also visible on the upper agent where this agent lives.
Show at runtime — If selected, the stock is visible on the presentation at runtime.
Color — The fill color of the stock icon.
Array — If selected, the stock may have several dimensions — it is an array. Properties for array variables look slightly different. Instead of one field defining the formula for the stock, there can be several fields defining formulas for some particular elements or sub-arrays. To add new section allowing to define one more formula, click the Add formula button. Defining formulas for array elements and sub-arrays is described in Defining equations for array variables.
Initial value — The initial value of the stock.
In the case the stock is a scalar, just type here the value. If none is specified, the stock is initialized with 0.
In the case the stock is an array, initialize it as described in Initializing arrays. If initial value is not specified, all elements of the array are initialized with zeros.Equation mode — Here you can choose the equation definition mode, either Classic or Custom. In Classic mode the stock formula is non-editable, it is automatically generated according to the stock and flow diagram created by the user. In Custom mode the formula of the stock is editable, the user can use any variables and functions there without any limitations. Equation modes are described in details in the Classic and custom modes section.
d(stock_name)/dt= — [Enabled if the Equation mode is Custom] The right hand of the differential equation defining how the stock value will change.
In the case this flow is of array type, there can be several fields defining formulas for some particular elements or sub-arrays of the array. To add new section allowing to define one more formula, click the Add formula button. Defining formulas for array elements and sub-arrays is described in Defining equations for array variables. - Array dimensions
-
Array properties are available only if this stock is of array type. To make the variable an array, select the Array check box on the General property page.
Available dimensions — The list of dimensions defined in this model.
Selected dimensions — The list of dimensions that will act as dimensions of this array variable.
These properties are used to define dimensions of the array variable.
Please refer to the Defining an array variable section for details. - Advanced
-
System dynamics units — If selected, you will be able to specify units of measurements for this variable in the edit box to the right. Having specified units for all elements of your stock-and-flow diagram, you may perform unit checking to find out dimension inconsistencies in your model.
Commonly there are flows going in or/and out of the stock. You can find the full information on creating stock-flow dependencies in Flow. The complete process of creating a simple system dynamics model is described in the System dynamics tutorial.
AnyLogic supports two alternative modes of defining stock formula: Classic and Custom.
AnyLogic automatically generates a formula for a stock according to the stock-and-flow diagram created by the user.
Stock value is calculated according to flows inflowing and outflowing the stock. The value of inflows i.e. flows that increase stock value, are added and the value of outflows, i.e. flows that decrease the stock are subtracted from the current value of the stock:
inflow1 + inflow2 … - outflow1 - outflow2 …
In the classic system dynamics notation only flows can appear in the formula. The formula is non-editable and no other elements except for flows flowing in and out the stock can appear in the formula.
Sometimes you may need to overcome the limitations of the classic system dynamics notation and use some other elements in stock formula or e.g. add some ratio factors for the existing flows. You may need this e.g. if you model a dynamic system with a differential equation system. For this case AnyLogic supports Custom equation style that enables the user to modify the stock formula and does not imply any limitations on types of elements used in the formula.
In the custom equation mode the formula of the stock is editable, the user can write any expression (actually the right hand of the differential equation) in the stock’s d(stock_name)/dt = formula field.
You can customize the stock appearance: namely, you can change the fill color and resize the stock. These changes are reflected either in the graphical editor and at the model runtime.
To change the stock color
- Select the stock in the graphical editor or in the Projects view.
- Go to its properties and choose the required color from the Color control.
To resize a stock
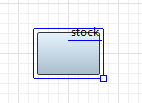
- Select the stock in the graphical editor with a mouse click.
-
You will see the little handle shown in the right bottom corner of the stock icon.
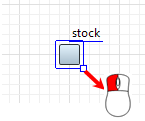
-
Drag this handle with the mouse and release the mouse button when you will get the stock of the required size:
To visualize stock value with a chart
- Right-click the stock element in the graphical editor and select Create Chart from the context menu, then select the desired chart type in the submenu. Here you can build either a bar chart or a time plot.
- The chart will appear in the graphical editor. You will be able to configure it in the Properties section.
If required, you can visualize the stock value using other AnyLogic charts from the Analysis palette.
Optionally you can associate some custom graphics with a stock so that it will reflect the value of the stock. Please have a look at the following demo model to get idea on the implementation:
Demo model: Stock of Money Animation Open the model page in AnyLogic Cloud. There you can run the model or download it (by clicking Model source files). Demo model: Stock of Money AnimationOpen the model in your AnyLogic desktop installation.-
How can we improve this article?
-