

Build your project by clicking the
 Build model toolbar button. If there are some errors in your model, the building fails and the
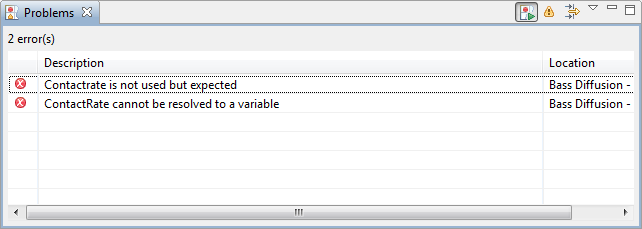
 Problems view appears listing all the errors found in your model. Double-click an error in the list to open the location of the error and fix it.
 Problems view
After the model is successfully built, you can start it. Running the simulation, you automatically bring the current model up to date.
To start the model
-
Choose the experiment you want to run from the drop-down list of the
 Run toolbar button. Your simulation experiment is called Bass Diffusion/Simulation.
Later on you can use the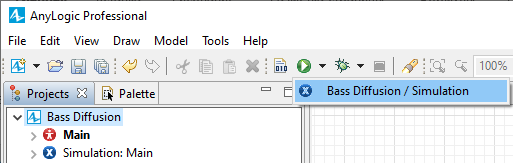 Run toolbar button to start the previously run experiment.
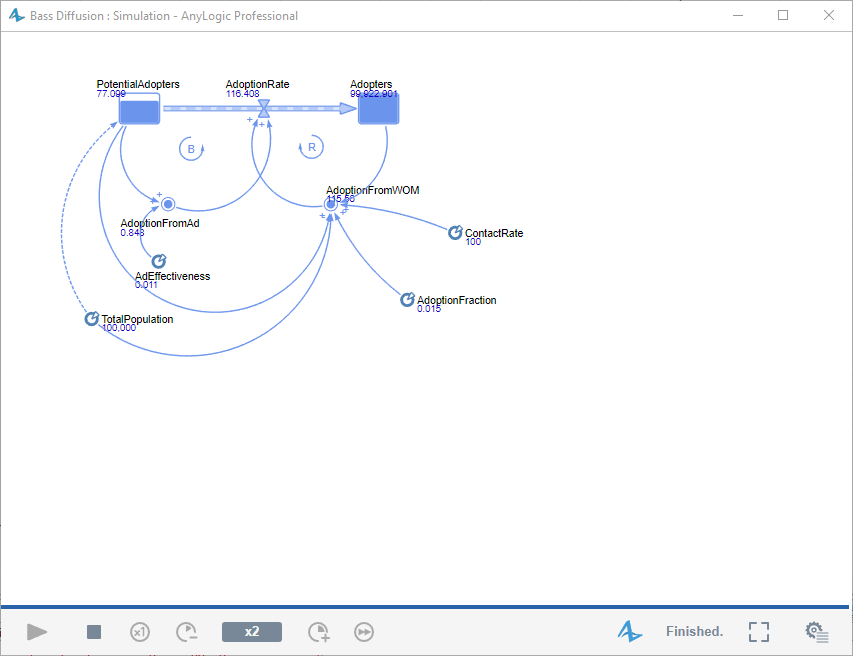
You will see the model window where animated stock-and-flow diagram is displayed. Elements of the diagram match the system dynamics notation. The actual values of variables are displayed as well.
You can adjust the execution speed to your needs using the Slow down  and Speed up toolbar buttons.
AnyLogic supports various tools for collecting, displaying, and analyzing data during model execution. The simplest way to examine the current state and history of a parameter or a variable during model simulation is to use an inspection window. We want to inspect our variables, AdoptionFromAd and AdoptionFromWOM, to view the contribution of different adoption sources.
To inspect adoption sources
- Click the AdoptionFromAd variable in the presentation. The light brown popup box will be shown. If needed, move it by dragging the toolbar of the window and resize it to the desired size by dragging the bottom right corner of the window.
- By default the window is in the inspection mode: it displays the current value of the variable. You can switch it to the plot mode. Hover the mouse over the inspection window title and click the
 button in the top right corner of the window. Now it shows the time plot that visualizes the trend for the AdoptionFromAd variable.
 - In the same manner, open the inspection window for AdoptionFromWOM and switch it to the plot mode.
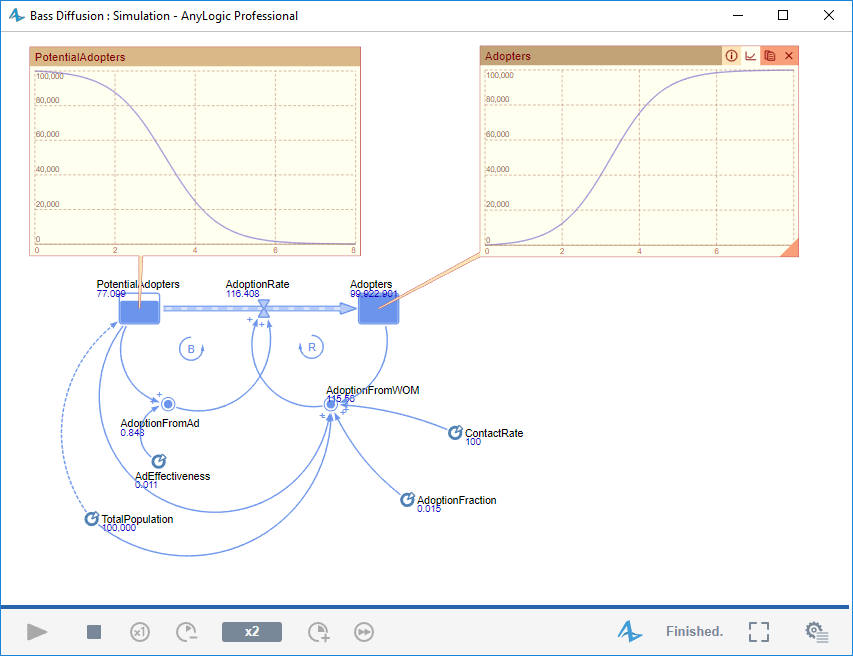
The “inspection” charts change scales automatically to embrace the plots, displaying the variables changing from the beginning to the end of simulation. We can easily see that when an innovation is introduced and the adopter population is zero, the only source of adoption will be advertising. The advertising effect is largest at the start of the diffusion process and steadily diminishes as the pool of potential adopters is depleted.
Demo model: Bass Diffusion — Phase 1 Open the model page in AnyLogic Cloud. There you can run the model or download it (by clicking Model source files). Demo model: Bass Diffusion — Phase 1Open the model in your AnyLogic desktop installation.-
How can we improve this article?
-