

First of all, we need to analyze the model to decide how it can be described in the system dynamics terms. We should distinguish the key variables of the model and their patterns of influence and then create stock and flow diagram of the model. When constructing stock and flow diagram, we should consider what variables should be modeled with stocks, flows or dynamic variables.
Stocks (also known as levels, accumulations, or state variables) change their value continuously over time. Flows, also known as rates, change the value of stocks. In turn, stocks in a system determine the values of flows. Intermediate concepts are known as dynamic variables and can change instantaneously.
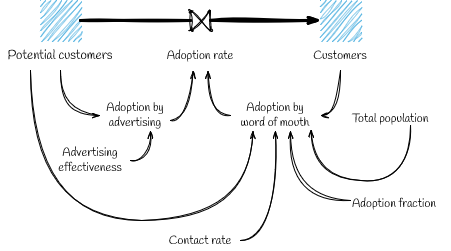
When constructing a stock and flow diagram, consider what variables accumulate over a period of time. In our model, adopter and potential adopter populations are stocks and the adoption rate — a flow.
The system dynamics presentation of the model is shown in the following figure. Stocks are denoted with squares, flow with a valve, and dynamic variables with circles. Arrows denote causal dependencies in the model.
-
How can we improve this article?
-