

The marketing strategy in the current model is very simple: at the specified moment of time company stops advertising the product.
Now we want to find an optimal marketing plan to reach the required number of adopters to the specified moment of time with minimal advertising expenditures. Let’s assume we need the market to be saturated to 80 percent at the end of the first 1.5 years.
We can solve this problem by using AnyLogic optimization, where selected model parameters are systematically adjusted to minimize or maximize the objective function.
- In the
 Projects view, right-click (macOS: Ctrl + click) the model item and choose New > Experiment from the popup menu. The New Experiment dialog box is displayed.
 -
Choose
 Optimization experiment from the Experiment Type list and click Finish.
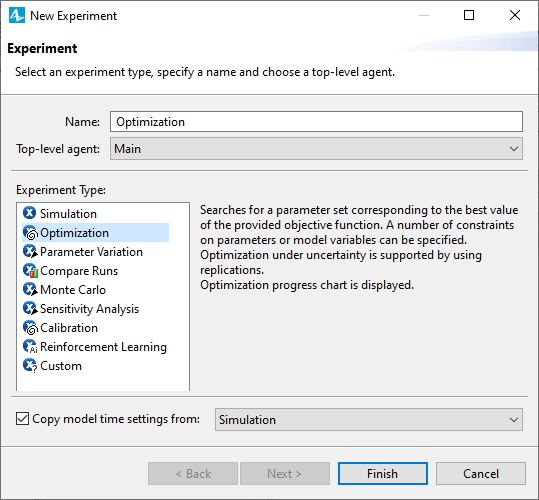
You will see that one more experiment is created and its presentation opened in the graphical editor.
Define the objective function
-
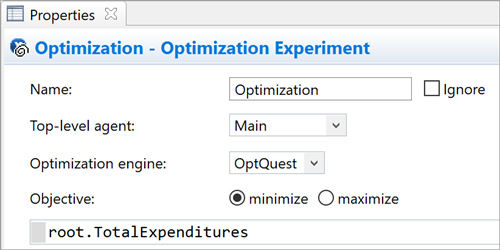
We want to minimize money spent on the product promotion. In the
 Properties view, type root.TotalExpenditures in the Objective field. Here we access the top level agent of the experiment as root.
-
Leave the minimize option selected.
Configure the optimization
- In the Properties of the experiment, ensure that each simulation ends. By default, simulation never ends; therefore the optimization engine gets no samples of the objective function. To ensure that each simulation ends, you must specify a simulation stop condition. Go to the Model time section of the experiment’s Properties and select Stop at specified time in the Stop drop-down list. In the Stop time edit box, type 1.5. The model will stop after 1.5 model time units (i.e. years) elapse.
We will optimize the parameters MonthlyExpenditures and SwitchTime. During optimization, these parameters will be systematically adjusted to find the smallest total expenditures leading to the required market saturation.
Define optimization parameters
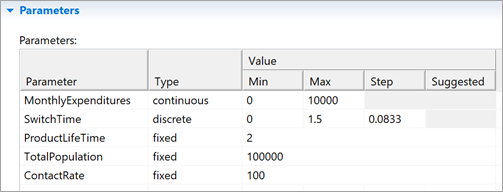
- In the Parameters section of the optimization experiment’s Properties you can see all parameters of the experiment’s top level agent. By default, all of them are fixed, i.e. they are not varied by optimization process. To enable optimizing a parameter, you should choose another option instead of fixed in the Type cells of the corresponding rows of the table.
- First, let’s setup the first parameter we want to vary during the optimization: MonthlyExpenditures. Choose continuous in the Type cell of the MonthlyExpenditures row. Set Max value for this parameter to 10000. Thus we tell the optimizer that this parameter may accept any real values from 0 to 10000.
-
Second, setup the parameter SwitchTime. Choose discrete in its Type cell since we want this parameter to have values only corresponding to particular timestamps: one month, two months, etc. Specify 0.0833 in the Step cell. This value corresponds to one month in our model, since 1 stands for one year and therefore one month is 1.0/12.0 = 0.0833. Finally set Max value for this parameter to 1.5.
Create the experiment’s UI
-
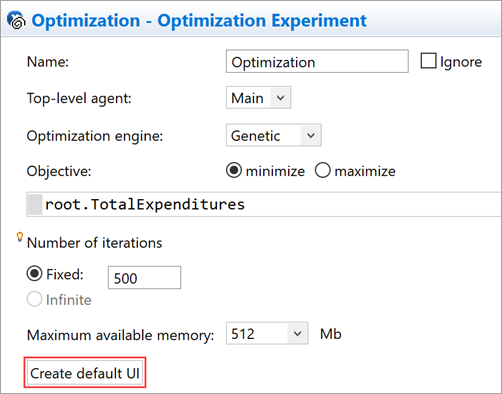
Click the Create default UI button in the properties view of the experiment.
-
This creates default UI for the optimization experiment as shown in the figure below. The default UI consists of a number of controls that will display all necessary information regarding the current status and the results of the optimization at the runtime.
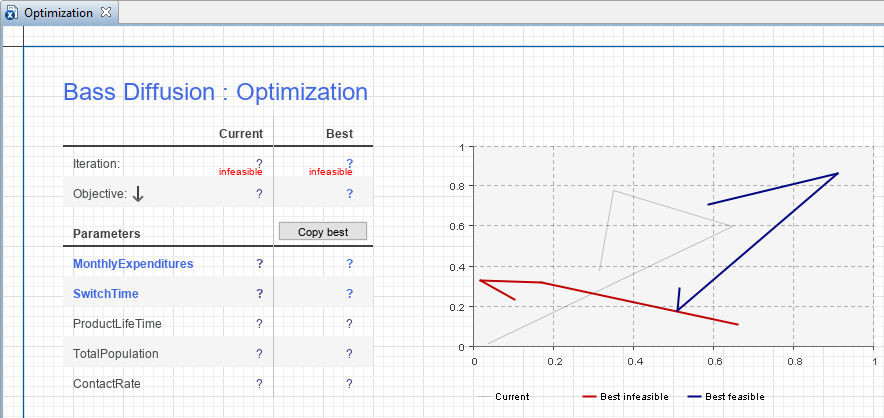 Creating the default UI deletes anything on the diagram of the optimization experiment, so we recommend you to create the UI first and then adjust it anyhow.
Now it is time to define the requirement for the successful simulation. We want 80000 people to adopt the product after first 1.5 years.
Define the requirement for the optimization experiment
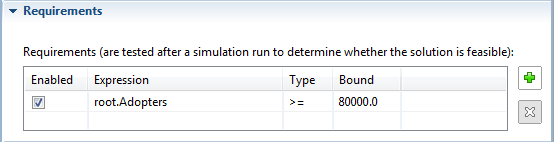
- Open the Requirements section of the optimization experiment’s Properties and define a requirement in the uppermost row of the Requirements (are tested after a simulation run to determine whether the solution is feasible) table.
- Type root.Adopters in the Expression cell. Here we access the top level agent of the experiment as root.
- Choose >= in the Type cell.
- Type 80000 in the Bound cell.
-
Finally select the checkbox in the leftmost column of this row of the table to enable this requirement.
We have finished defining the requirement. It will be checked at the end of simulation. If this requirement is not met, the solution is considered as infeasible.
The model is now ready to optimize.
Run the optimization
- Right-click (macOS: Ctrl + click) the optimization experiment in the Projects view and choose Run from the context menu. You will see the model window opened, showing the UI you have created for this experiment.
- Click the
 Run control in the model window to start the optimization process.
 - AnyLogic will run the model 500 times, adjusting the values of MonthlyExpenditures and SwitchTime. A summary of the optimization statistics will be displayed in the controls on the canvas of the model window.
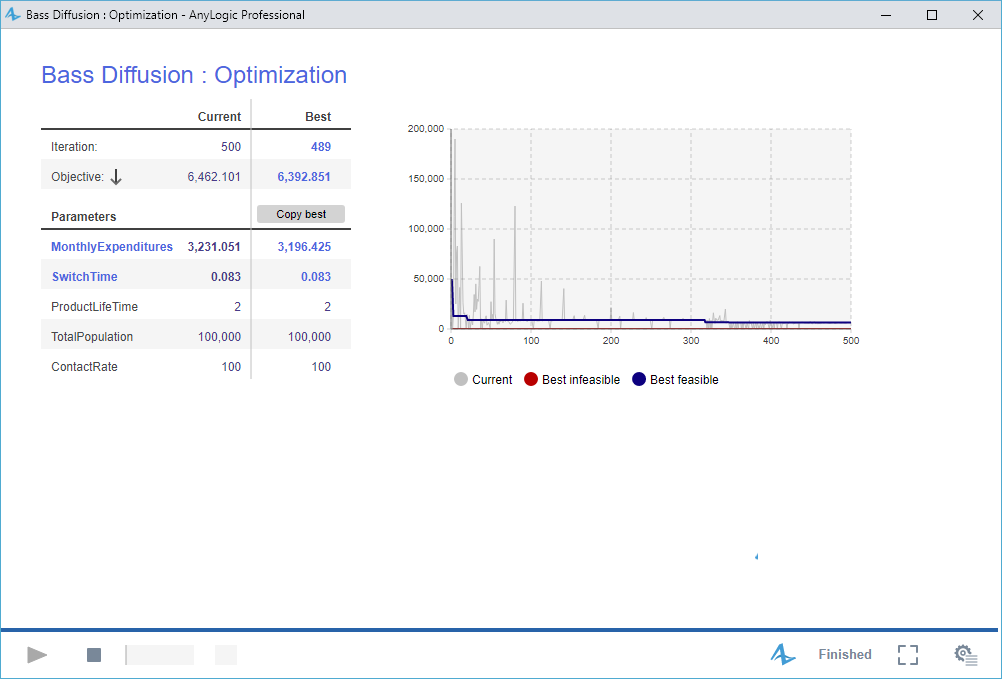
When the optimization process finishes, you will see the Best objective found. In the Best column of the Parameters table you can find the values of SwitchTime and MonthlyExpenditures parameters that correspond to this best objective value.
Now we can update the model with the optimized values of SwitchTime and MonthlyExpenditures. Save the obtained parameter values in the Simulation experiment to adopt the found solution in the model.
Adopt optimization results
- Right after finishing the optimization, click the Copy best button on the canvas of the model window. Thus you copy the optimal parameter values to the Clipboard.
- Close the model window and select the Simulation experiment in the Projects view.
- Paste the values from the Clipboard by clicking the Paste from clipboard button in the experiment’s properties view.
Run the
 Simulation experiment experiment. Now the model will be launched with optimal parameters resulting in the best found solution. You can check that the required number of adopters is reached by the required time (1.5 years).
Now you have planned your entry strategy so as to have an efficient and effective product promotion.
Demo model: Bass Diffusion — Phase 6 Open the model page in AnyLogic Cloud. There you can run the model or download it (by clicking Model source files). Demo model: Bass Diffusion — Phase 6Open the model in your AnyLogic desktop installation.-
How can we improve this article?
-