

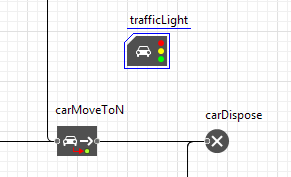
In this phase we will make a controlled intersection by adding traffic lights to the flowchart.
To define the working mode for one or more traffic lights controlling traffic flow on an intersection or a pedestrian crossing we must use the Traffic Light block from the Road Traffic Library.
Define logic for traffic lights
-
Add the
 Traffic Light block to the flowchart from the
 Road Traffic Library palette. This block has no ports and you do not have to connect it to any other flowchart blocks. You can place it in absolutely any area of the graphical editor.
-
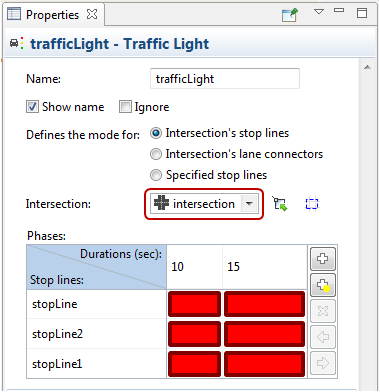
Open the block’s properties. Pay attention to the main block’s parameter: Defines the mode for. This parameter has three alternative options:
- The Intersection’s stop lines option (selected by default). In our case we should leave this option selected by default, as the traffic lights created by this block will control traffic (enabling / disabling traffic flow) on all lanes of the adjacent to the intersection road at once.
- The Intersection’s lane connectors option is used when the allowed traffic directions on the controlled intersection differ for lanes of one and the same road during the same traffic light phase.
- The Specified stop lines option is used when simulated by this block traffic lights control traffic at one or more pedestrian crossings, defined by the AnyLogic stop lines.
-
In the Intersection parameter choose the name of the previously created intersection: intersection.
-
Once you have specified the intersection in the
Traffic Light properties, all its stop lines will be listed in the Phases table below. Here you define red, green (and optionally yellow) phase durations for every stop line of the selected intersection.
-
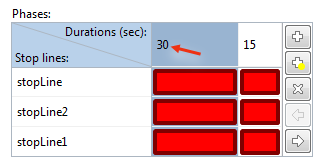
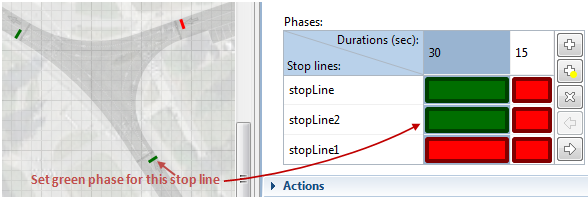
Let us define the traffic light phases. We want the 30 second green phase enabling traffic flow along the Tapiolavagen road (during which the traffic flow coming from the Menninkaisentie road towards the intersection is disabled) to switch to the 20 second red phase (green phase to turn from Menninkaisentie). These phases will be endlessly switching from one to another. By default the table contains two columns, one for each phase. We need to define the green and the red phase for each stop line. Start with configuring the first phase. Click in the table header to edit the phase length. Set it to 30 seconds.
-
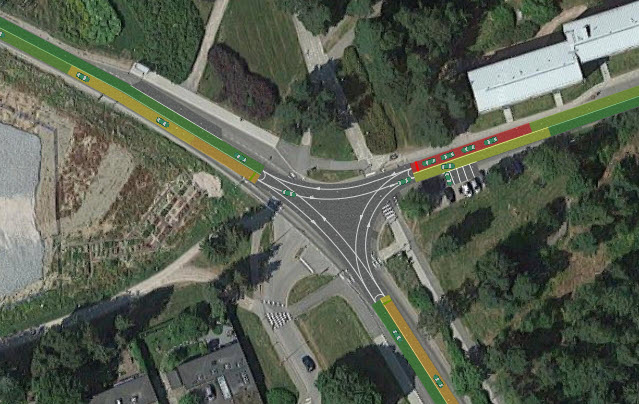
Since we selected the Phases table cell that refers to the first traffic light phase, you can see that all shapes in the graphical editor are grayed out, while the stop lines are marked in red. It means that we entered the phase editing mode, allowing you to easily change each stop line’s state for the current phase right in the graphical editor.
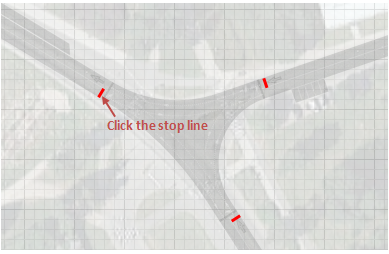
- Click on a stop line in the graphical editor as shown on the screenshot above. The stop line’s color will switch from red to green (the corresponding table cell in the Phases table will also change its color).
-
In the same way make the first traffic light phase green for the other stop line located on the same road as well.
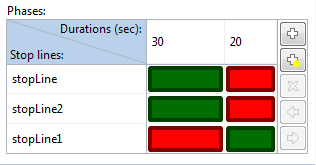
- Now we shall configure the second phase. Click on the second column’s title and set the length of this phase to 20 seconds. Then click on the stop line located on the Menninkaisentie road access.
-
Finally the Phases table should look like this:
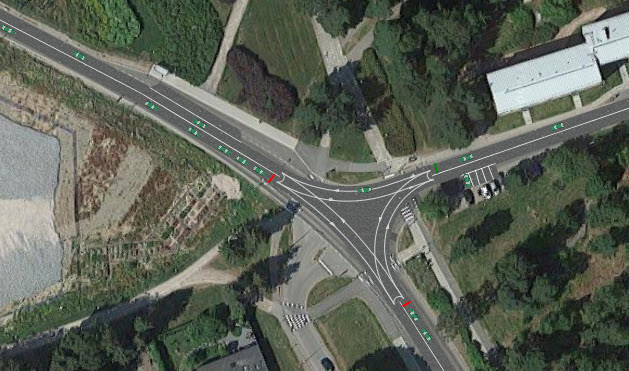
Run the model. You will see that traffic light phases switch each other, enabling traffic flow either on the main road (Tapiolavagen) or on the Menninkaisentie road access.
To have a better understanding of the traffic jams currently present in the simulated road network due to the traffic lights, you should enable car density map.
To show car density map
-
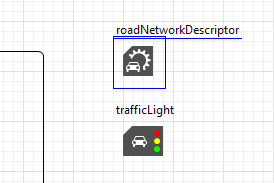
Add the
 RoadNetworkDescriptor element onto the graphical diagram from the
Road Traffic Library palette. There is also no need to connect this element to any other flowchart blocks.
RoadNetworkDescriptor element onto the graphical diagram from the
Road Traffic Library palette. There is also no need to connect this element to any other flowchart blocks.
- Modify the element’s properties. Choose the name of the created road network (roadNetwork) from the Road network drop-down list.
-
Open the Density map section of
RoadNetworkDescriptor properties and select the Enable density map checkbox.
Run the model and examine the current traffic situation on the intersection.
Now you can try switching traffic light modes (e.g. set duration of phases to 30 / 20 or 30 / 30 seconds) and finding the mode offering the best result for the drivers.
That is one of the numerous examples showing practical usage of the Road Traffic Library. Road traffic models are usually created to analyze and compare different traffic organization variants (e.g. adding traffic light), model roads and junctions that are being designed to uncover bottle necks, check the viability of increasing or decreasing lane’s quantity on a certain segment of the existing road network. Alongside this, AnyLogic Road Traffic Library allows to add (3D) animation to the traffic in your model (airport shuttle buses and taxi cars, semi-trucks in logistics center etc.), driving your model’s animation in this way to a completely new level.
Demo model: Road Traffic Tutorial - Phase 6 Open the model page in AnyLogic Cloud. There you can run the model or download it (by clicking Model source files). Demo model: Road Traffic Tutorial - Phase 6Open the model in your AnyLogic desktop installation.-
How can we improve this article?
-