

This document describes how to control traffic on the intersection with the help of traffic lights (the Traffic Light block of the Road Traffic library).
To learn how to draw an intersection, follow the short tutorial available in Intersection.
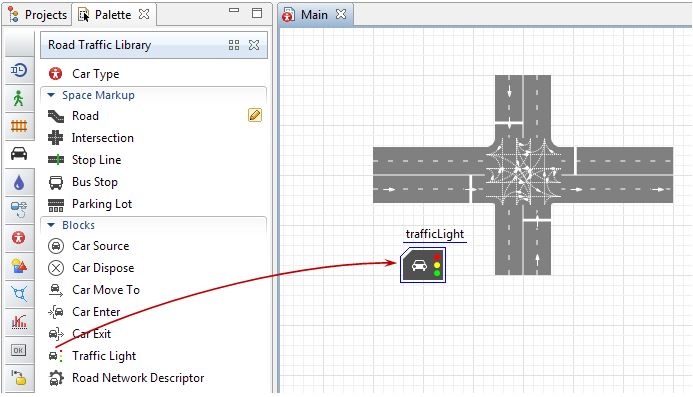
Add a traffic light
- Drag the
 Traffic Light element from the
  Road Traffic Library palette to the agent diagram containing an intersection. It is not necessary to place it close to the intersection (however, this may help to understand the model logic).
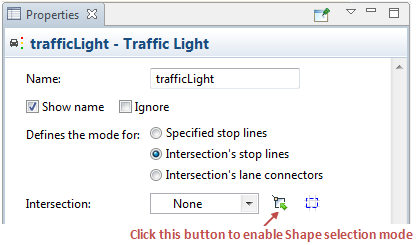
- Open the Properties of the traffic light. Leave the default option Defines the mode for: Intersection’s stop lines selected since we want this traffic light to control traffic (stop / enable) for all lanes of each road at the intersection.
- Specify the intersection that is controlled by this Traffic Light block. In the traffic light properties, click the
 button to the right of the Intersection combo box.
- This activates the shape selection mode. You will see that all shapes but the intersections are grayed out in the graphical editor. Click the intersection that will be controlled by this Traffic Light block.
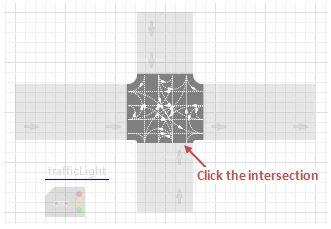
- The intersection name will be inserted in the Intersection combo box. Selecting the required shape in the graphical editor saves you from remembering its name (that is extremely useful if you have plenty of shapes in your model).
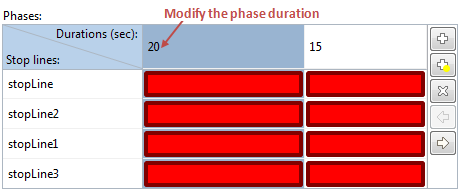
- Now you should specify the traffic light phase durations. Every road connected to the intersection requires a stop line on the lane with traffic moving towards the intersection. Having specified the intersection in the Traffic Light properties, you will see all stop lines of this intersection listed in the Phases table below. Here you define red, green (and optionally yellow) phase durations for every stop line of the selected intersection. Let us set up the traffic light phases step by step.
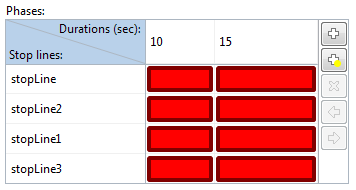
- In our case the traffic on the horizontal road is allowed to move during the twenty-second phase, then it is stopped for 20 seconds allowing the cars on the vertical road to drive through. By default the table contains two columns, one for each phase. We need to define the green and the red phase for each stop line. Start with configuring the first phase. Click in the table header to edit the phase length. Set it to 20 seconds.
- You will see that all shapes are grayed out in the graphical editor, while the stop lines are marked in red. It means that we entered the phase editing mode, allowing you to easily change each stop line’s state for the current phase right in the graphical editor.
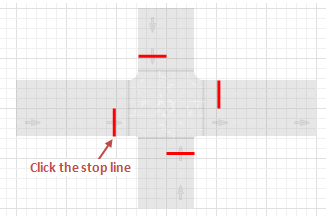
- Click a stop line in the graphical editor to change its state. The stop line’s color will switch from red to green (the corresponding table cell in the Phases table will also change its color).
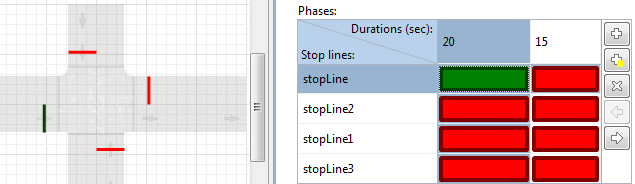
- The state of another stop line located on the horizontal road needs to be changed for the first phase as well. These stop lines belong to the same road, which means that they should have the same phases.
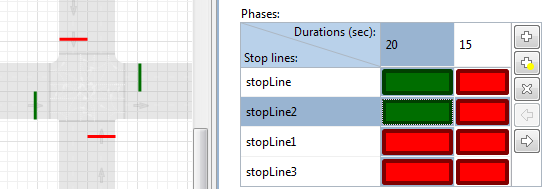
- Now we shall configure the second phase. Set its duration to 20 seconds in the Phases table, and click each of the two stop lines located on the vertical road to change their color to green.
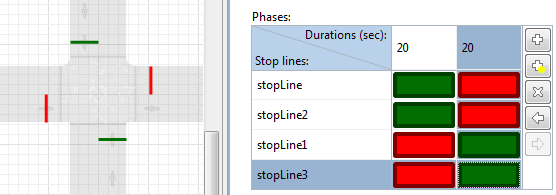
- Finally the Phases table should look like in the figure above.
-
How can we improve this article?
-