

When you launch AnyLogic for the first time, you see the welcome page. Closing it by clicking the close button x  in the tab of the page you will see the AnyLogic workspace:
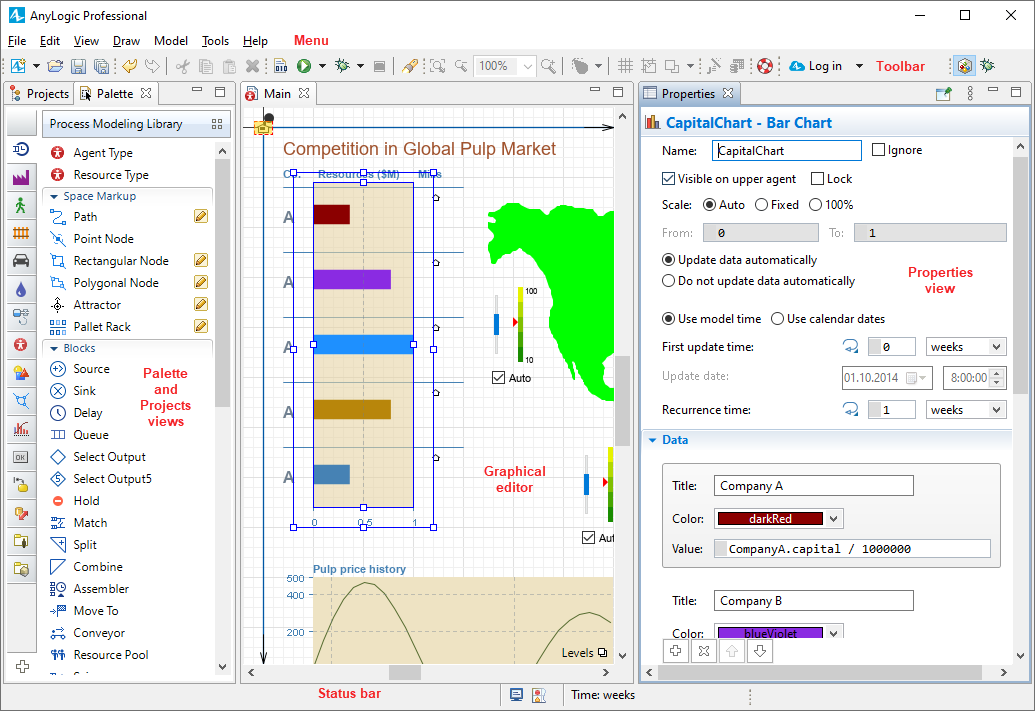
At the very top of the window the menu is located, under the menu — the toolbar providing the easy access to the most frequently used commands. At the bottom you can see the status bar.
By default the following components are shown in the workspace:
- Graphical editor — The place to edit graphical diagrams of agents and experiments.
- Projects view — Provides access to AnyLogic models currently opened in the workspace. The workspace tree provides easy navigation throughout the models.
- Palette view — Provides the list of model elements grouped by categories in a number of stencils (palettes).
- 3D Preview — Provides an enhanced view of your 3D animation during design time.
- Properties view — Allows to view and modify the properties of currently selected model item(s).
You can customize the workspace by closing some views and opening other ones (there are also Problems, Search, Console views available). AnyLogic Professional also provides a set of views for the model debugging: Debug, Breakpoints, Expressions, Variables.
-
How can we improve this article?
-