


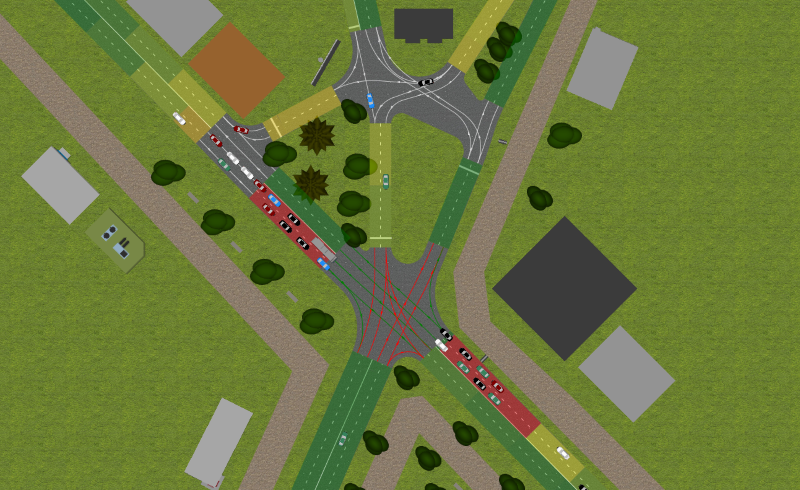
AnyLogic allows you to display the car density map. It shows the current traffic jams on the simulated road network.
Demo model: Displaying Traffic Jams Open the model page in AnyLogic Cloud. There you can run the model or download it (by clicking Model source files). Demo model: Displaying Traffic JamsOpen the model in your AnyLogic desktop installation.If this option is enabled, the layout will gradually change colors as cars move through the simulated space. The color of each road segment corresponds to the current car density on it. The density map uses colors from green to red to display different car densities. The color red is used to indicate road segments with critical densities (traffic jams). The color green is used to show road segments with normal traffic.
The density map is constantly repainted according to the actual values: if the density changes on some road segment, its color changes dynamically to reflect this change.
By default, the car density map is not shown, but you can turn it on with a single click.
To show car density map
- If you have not yet added the Road Network Descriptor block, drag the Road Network Descriptor block from the Blocks section of the Road Traffic Library palette onto the graphical diagram where your car traffic flowchart is defined.
- In the Road network combo box, select the road network you are working with.
- Open the Density map section of the Road Network Descriptor properties.
- Select the Enable density map check box.
Now, when you run your car traffic model, you will see the car density map displayed.
To configure the density map
- Open the Density map section of the Road Network Descriptor properties.
- If you are unhappy with the way the car density map is painted over the model animation, making it barely visible, set a different density map transparency level by specifying a new value in the Map Transparency (0..1) edit box, in the Road Network Descriptor properties. The box allows values in the range [0..1]. 0 means fully transparent map (the density map is not visible), 1 means fully opaque density map (the animation below the density map is not visible at all). The default value for transparency is 0.6.
- You can customize the speed level corresponding to the density map’s green color. Set your own speed in the Green speed level property. The road segment will be drawn in green if cars can move on this segment with the speed defined in this property (or faster). By default, the green speed level is 60 kilometers per hour.
- You can also adjust the length of the density map segment in the Map section length property.
-
How can we improve this article?
-