


The Statistics object calculates statistical information (mean value, minimum, maximum, and so on) on a series of data samples of type double.
The element works differently depending on whether the data is considered discrete or continuous.
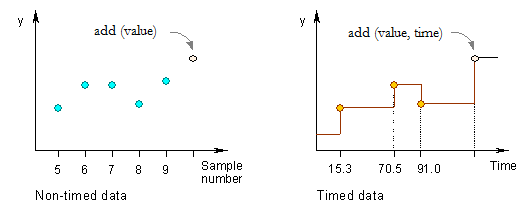
Data samples are time persistent: the value persists in continuous time but changes only at discrete points in time (for example, queue length). The samples must be added to this statistic with ascending time stamps. The mean, variance, and other similar functions assume that the last added value holds until the time of the call. The mean of such a data set is a time-weighted value.
Samples have no duration in time (for example, the cost of products or the length of a patient’s stay). They occur as isolated, discrete points in time, so the mean is simply the sum of the individual samples divided by the number of samples.
To create a statistics object
- Drag the
 Statistics element from the
  Analysis palette into the graphical editor.
 - Go to the Properties view.
- Specify whether to treat the data samples as Discrete or Continuous.
- In the Value edit box, enter the expression that evaluates the value of the data item.
- Finally, select how you want this data element to be updated.
While the model is running, you can view and optionally copy the collected data to the clipboard so that later on you can paste it into another application (such as Microsoft Excel) to perform statistical analysis.
- General
-
Name — The name of the statistics object. The name is used to identify and access the statistics.
Ignore — If selected, the statistics object is excluded from the model.
Discrete — If selected, data are considered discrete (samples have no duration in time).
Continuous — If selected, data are considered continuous (samples have duration in time).
Value — Expression that will be dynamically evaluated to obtain the current data sample.
- Data update
-
Update data automatically — If selected, new data samples are added automatically starting at the exact time (select the option Use model time) or date (select Use calendar date) specified below and repeating with the specified Recurrence time. Otherwise, you should add new samples by yourself dynamically.
- Expert
-
Visible — If selected, the statistics object is visible on a presentation at runtime.
You can work with the collected data using the API of the Statistics element. The set of functions differs depending on the type of the Statistics element:
- Continuous — the element is an instance of the StatisticsContinuous class.
- Discrete — the element is an instance of the StatisticsDiscrete class.
- Continuous statistics
-
Function Description void add(double value, double time) Adds a new data sample to the statistics, that is, notifies the statistics about the value change at the given time.
value — the new value.
time — the time.int count() Returns the number of samples added to the statistics. void reset() Discards all statistics accumulated. double max() Returns the maximum sample value, or -infinity if no samples have been added. double min() Returns the minimum sample value, or infinity if no samples have been added. String toString() Returns the tab-separated multiline textual representation of the statistics. double deviation() Returns the deviation of the statistics at the time of last update. double deviation(double time) Returns the standard deviation of the statistics at the given time, assuming that the last value added holds until the given time.
time — the point in time for which the standard deviation is calculated. If no new values have been added since the last recorded entry, the last value is assumed to hold until this time.double integral() Returns the mean integral of the statistics at the time of last update, or 0 if no samples have been added. double integral(double time) Returns the integral of the statistics at the given time assuming the last value added holds until the given time, or 0 if no samples have been added.
time — the point in time up to which the integral is calculated. If no new values have been added since the last recorded entry, the last value is assumed to persist until this time. If no values have been added at all, the result is 0.double mean() Returns the mean of the statistics at the time of last update, or 0 if no samples have been added. double mean(double time) Returns the mean of the statistics at the given time assuming the last value added holds until the given time, or 0 if no samples have been added.
time — the point in time up to which the mean is calculated. If no new values have been added since the last recorded entry, the last value is assumed to persist until this time.double meanConfidence() Returns the half-width mean confidence of the statistics at the time of last update, or 0 if no samples have been added. Mean confidence interval is calculated in assumption that confidence level is equal to 95%. double meanConfidence(double time) Returns the half-width mean confidence interval of the statistics at the given time assuming the last value added holds until the given time, or infinity if less than 2 samples have been added or if no time has elapsed. Mean confidence interval is calculated in assumption that confidence level is equal to 95%.
time — the point in time up to which the half-width of the mean confidence interval is calculated. If no new values have been added since the last recorded entry, the last value is assumed to persist until this time.double variance() Returns the variance of the statistics at the time of last update, or 0 if no samples have been added. double variance(double time) Returns the variance of the statistics at the given time assuming the last value added holds until the given time, or 0 if no samples have been added.
time — the point in time up to which the variance is calculated. If no new values have been added since the last recorded entry, the last value is assumed to persist until this time. - Discrete statistics
-
Function Description void add(double value) Adds a sample value to the statistics.
value — the value to add.int count() Returns the number of samples added to the statistics. void reset() Discards all statistics accumulated. double max() Returns the maximum sample value, or -infinity if no samples have been added. double min() Returns the minimum sample value, or infinity if no samples have been added. String toString() Returns the tab-separated multiline textual representation of the statistics. double deviation() Returns the standard deviation of the statistics. double mean() Returns the mean of the statistics, or 0 if no samples have been added. double meanConfidence() Returns the half-width mean confidence interval of the statistics element, or 0 if no samples were added. The mean confidence interval is calculated assuming that the confidence level is 95%. double sum() The function returns sum of the samples added to the statistics, or 0 if no samples have been added. double variance() Returns the variance of the statistics, or 0 if less than 2 samples have been added.
You can visualize the collected statistics with charts.
The Statistics element differs from the Data set element in that it does not store the series of data samples themselves, but only the statistical information (mean value, minimum, maximum, and so on) collected on these samples. Each metric can be obtained using the corresponding function of the Statistics element: mean(), min(), max(), and so on.
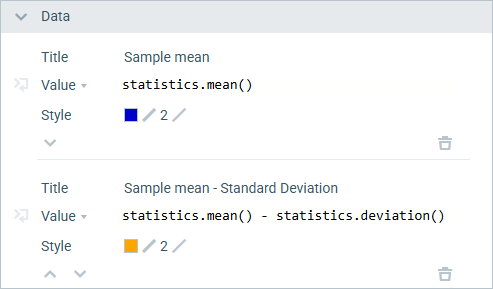
Demo model: Statistics as Function of the Number of Observations Open the model page in AnyLogic Cloud. There you can run the model or download it (by clicking Model source files). Demo model: Statistics as Function of the Number of ObservationsOpen the model in your AnyLogic desktop installation.You can learn how to visualize the collected statistics using the above demo model. Here, the statistics are visualized with the time plot. In the Data section of its properties, you can see the data items, most of which display the metrics obtained from the Statistics element statistics.
Since the functions return scalar values, you must select the Value option to visualize them. The statistics element in this model is named statistics, so you call its functions in the Value field as statistics.mean(), statistics.mean() - statistics.deviation(), and so on.
-
How can we improve this article?
-