


If none of the probability distributions readily available in AnyLogic fit your data, you can define your own custom, or empirical, distribution.
After defining the custom distribution, you can draw random values from your distribution by calling the function with the same name as your distribution, e.g., myDistribution().
To define a custom distribution
- Drag the
 Custom Distribution element from the
  Basic Elements palette onto the graphical diagram.
 - Go to the element properties to define the distribution by entering data.
- Select the Type of the distribution — the type of values the distribution returns. It can be either Discrete or Continuous.
- Select how the data of the distribution is introduced with the Define using control. There are several options:
- Frequency table
- Observed samples
- Options (only for the Discrete type)
- Ranges (only for the Continuous type)
- Define data for the custom distribution in the Data section of the element properties. There are two options:
- To load table data from an AnyLogic database already imported to your model, select Loaded from database and specify the source table using the Database query field. Click create to open the Database reference dialog. Click the Table field and select the required table from the list. If needed, define the conditions for selecting particular values from the database table in Choice conditions. Click OK. Back in the Data section, specify the Argument column and Value column by selecting the database table columns from the drop-down lists.
- You can also enter table data manually or copy and paste it from an outside source. When Loaded from database is not selected, a table is visible where each (Value, Weight) pair can be specified in an individual row. To add a row, click
 Add. To define a pair of values, enter the data in the respective cells. To introduce an entire table, copy it from the source and click
  Paste. To remove a value pair, hover over the corresponding row and click the
  Delete row button to the right.
- General
-
Name — The name of the custom distribution. The name is used to identify and access the element from code. You call the distribution like a function, e.g., myDistribution().
Show name — If selected, the distribution name is displayed on the presentation diagram.
Ignore — If selected, the custom distribution is excluded from the model.
Type — The type of values the distribution returns:
- Discrete — The distribution returns discrete values defined from those defined in the table.
- Continuous — The distribution returns continuous data: it can return any value from the specified range.
Define using — Specifies how the distribution data is defined:
- Frequency table — Defines the distribution with a frequency table. You specify the possible values and their weights.
- Observed samples — Loads the observed values as they are.
- Options — [Visible only if the Type is Discrete] Allows you to specify probabilities for each option in the chosen option list.
- Ranges — [Visible only if the Type is Continuous] Defines the distribution with ranges. You specify the start and end values, and their weights.
Returns integer values — If selected, the distribution returns only integer values, and ranges include both endpoints. Otherwise, ranges include only the start point.
Option list — [Visible only if Define using is set to Options] Here you select the option list for this custom distribution. The distribution will define the probability of occurrence for each option in this list.
- Data
-
Here you define the data for the custom distribution. Data can be specified in the table or loaded from a preloaded AnyLogic database added to this model.
Loaded from database — If selected, allows you to load data from an existing AnyLogic database.
Database query — [Visible when Loaded from database is selected] Opens the Database reference menu:
- Table — Here you can select the table in a specified AnyLogic database that contains the required data.
- Choice conditions — Here you define one or more conditions that will specify the particular values to be selected from the specified table column.
Value column — [Visible if Frequency table or Observed samples is selected in Define using] The column of the database table that contains values.
Option column — [Visible only if Options is selected in Define using] The column of the database table that contains options of the option list. This column’s Type should be exactly the same option list that is specified in the Option list property of this custom distribution.
Start column — [Visible if Ranges is selected in Define using] The column of the database table that contains the values the data ranges start from.
End column — [Visible if Ranges is selected in Define using] The column of the database table that contains the values the data ranges end with.
Weight column — [Visible if Frequency table, Options or Ranges is selected in Define using] The column of the database table that contains probabilities for the corresponding values in the Value column or Option column.
- Preview
-
Here you can see the custom distribution preview — a histogram generated according to the custom distribution you have defined.
- Expert
-
Visible — If selected, the custom distribution icon is visible in the presentation animation at model runtime.
In the Observed samples mode, you simply load the observed values as they are. The frequency of a particular value depends on the number of times this value appears in the table (the number of times this value was observed). Use this mode if you have a table of observed data. The easiest way to load data into the model is to load it from your database or copy it to the clipboard from the data source and paste it by clicking the ![]() Paste button below the table in the Data property section.
Paste button below the table in the Data property section.
- Example
-
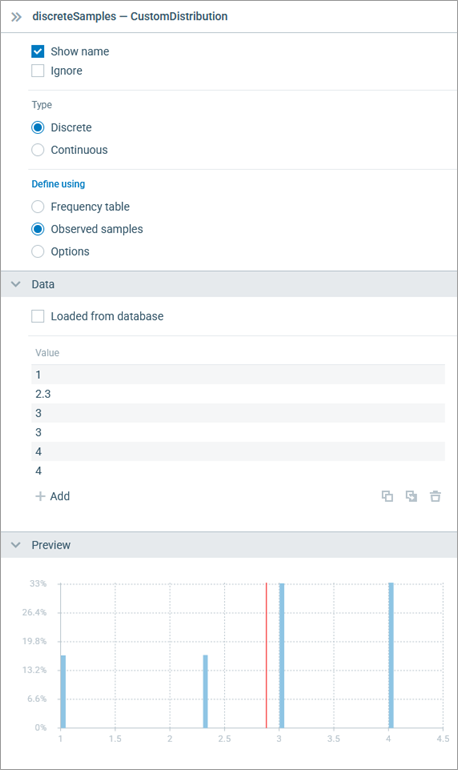
In the given example, we have defined a discrete custom distribution. In the Data table, you can see real values — there is no restriction to have only integer values defined for a discrete distribution; you may have real values as well.
As you can see, two values (3 and 4) are listed twice, while other values are listed just once. These values have twice the weight, which relates to the occurrence probability.
You define a continuous custom distribution in the same way as described above for a discrete custom distribution. However, all values from the composed value range can be returned by the distribution, not just the values present in the Data table.
In the Frequency table mode, you define values in the first column of the table and the corresponding weights in the second column. If the distribution is Continuous, linear interpolation is applied, so you are actually defining sloped ranges.
- Example
-
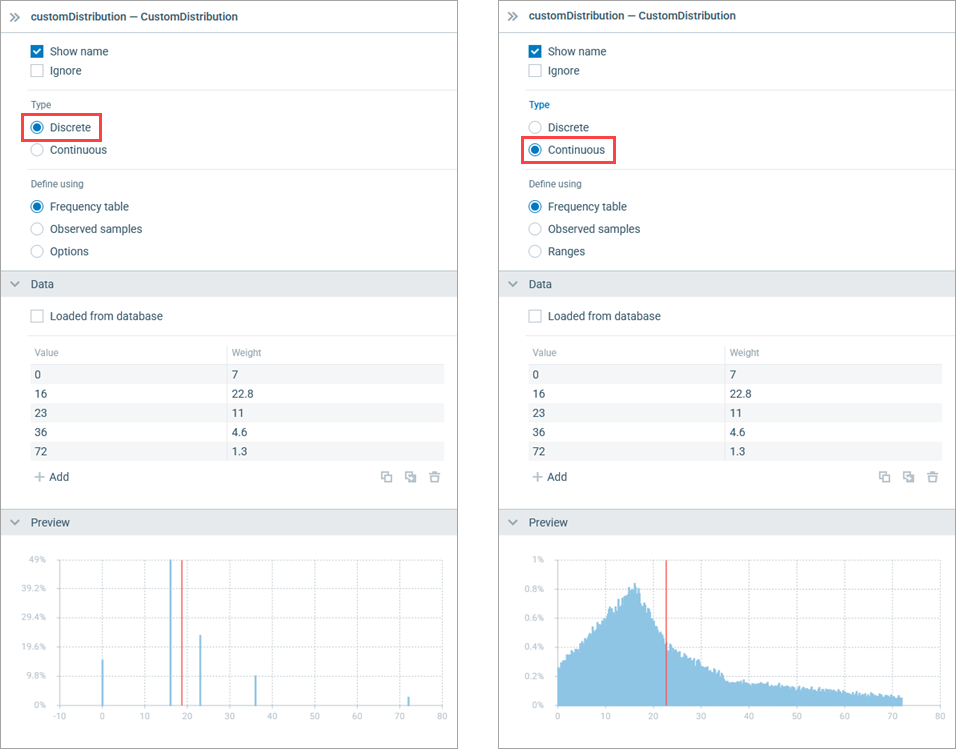 Discrete and continuous distribution defined using a frequency table
Select the Continuous type of the custom distribution and then select Define using: Ranges.
Define ranges and probabilities (weights) for these ranges. The ranges may not follow one another, such as [0, 12], [14, 22].
- Example
-
In the example shown below, the Returns integer values option is disabled, so the ranges do not include the end points, and both the second and the last range have a value of 3.0, which is used to define the start/end point of the range.
On the preview of the custom distribution, no data is defined for the range (1.5, 2). The ranges (2, 3) and (3, 5) have the same weight, but the preview shows that the probability of the values in the (2, 3) range is higher since this range is smaller than the (3, 5) range.

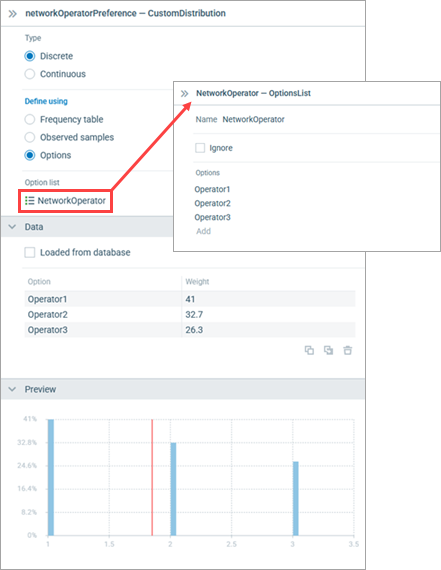
Select the Discrete type of the custom distribution and then select Define using: Options. Select the required option list in the Option list drop-down list and define probabilities for the options in the Weight column.
- Example
-
Assume we have the NetworkOperator option list in the model defining names of major network operators in the country. The custom distribution defining the preference of a specific network operator may look as follows:
AnyLogic supports two ways of creating an empirical distribution programmatically:
- You can create a custom distribution from an existing table function using the table function’s API.
- You can use one of the constructors of the corresponding Java class.
The corresponding API is described below.
- Creating a distribution from a table function
-
Function Description CustomDistributionAbstract<Double> createCustomDistribution() Constructs and returns a custom distribution from the table function. Takes the table function’s interpolation type and checks if it is supported. The random number generator is not set after this constructor and must be provided in each call of the get(Random) method. CustomDistributionAbstract<Double> createCustomDistribution(Random random) Constructs and returns a custom distribution from the table function. Takes the table function’s interpolation type and checks if it is supported. The random number generator is set after this constructor, so you can use both get() and get(Random) methods.
random — Random number generator that will be used - CustomDistributionDiscrete() constructors
-
Constructor Description CustomDistributionDiscrete(double[] samples) Constructs a custom distribution from the array containing observed samples. The array can be unsorted and can contain duplicate values — the number of value occurrences defines the weight of the value.
samples — The array of observed samplesCustomDistributionDiscrete(double[] samples, Random random) The same as CustomDistributionDiscrete(double[] samples), but enables using a custom random number generator.
samples — The array of observed samples
random — Random number generatorCustomDistributionDiscrete(double[] values, double[] weights) Constructs a custom distribution from the given array of values and weights. N values with weights will be converted into N-1 ranges, which define a piecewise linear function for the probability distribution function.
values — The array of values (at least two), duplicate values are not allowed
weights — The array of weights (same size as values, negative values are not allowed)CustomDistributionDiscrete(double[] values, double[] weights, Random random) The same as CustomDistributionDiscrete(double[] values, double[] weights), but enables using a custom random number generator.
values — The array of values (at least two), duplicate values are not allowed
weights — The array of weights (same size as values, negative values are not allowed)
random — Random number generatorCustomDistributionDiscrete(Map<Double, Double> valuesWeightsMap) Constructs a custom distribution from the given map with values and weights.
valuesWeightsMap — Map with <value, weight> pairs (negative values are not allowed)CustomDistributionDiscrete(Map<Double, Double> valuesWeightsMap, Random random) The same as CustomDistributionDiscrete(Map<Double, Double> valuesWeightsMap), but enables using a custom random number generator.
valuesWeightsMap — Map with <value, weight> pairs (negative values are not allowed)
random — Random number generator - CustomDistributionContinuous() constructors
-
Constructor Description CustomDistributionContinuous(double[] samples) Constructs a custom distribution from the array containing observed samples. The array can be unsorted and can contain duplicate values — the number of value occurrences defines the weight of the value.
samples — The array of observed samplesCustomDistributionContinuous(double[] samples, Random random) The same as CustomDistributionContinuous(double[] samples), but enables using a custom random number generator.
samples — The array of observed samples
random — Random number generatorCustomDistributionContinuous(double[] values, double[] weights) Constructs a custom distribution from the given array of values and weights. N values with weights will be converted into N-1 ranges, which define a piecewise linear function for the probability distribution function.
values — The array of values (at least two), duplicate values are not allowed
weights — The array of weights (same size as values, negative values are not allowed)CustomDistributionContinuous(double[] values, double[] weights, Random random) The same as CustomDistributionContinuous(double[] values, double[] weights), but enables using a custom random number generator.
values — The array of values (at least two), duplicate values are not allowed
weights — The array of weights (same size as values, negative values are not allowed)
random — Random number generatorCustomDistributionContinuous(double[] starts, double[] ends, double[] weights) Constructs a custom distribution from the given arrays of range start values, range end values, and range weights. Ranges should not intersect. The end of one range can be the beginning of another range. For example, ranges [0; 2] and [2; 3] are valid, whereas [0; 2] and [1; 3] are not.
starts — The array of range start values (at least one value)
ends — The array of range end values (same size as starts, each end value should exceed the corresponding start value)
weights — The array of weights (same size as starts, negative values are not allowed)CustomDistributionContinuous(double[] starts, double[] ends, double[] weights, Random random) The same as CustomDistributionContinuous(double[] starts, double[] ends, double[] weights), but enables using a custom random number generator.
starts — The array of range start values (at least one value)
ends — The array of range end values (same size as starts, each end value should exceed the corresponding start value)
weights — The array of weights (same size as starts, negative values are not allowed)
random — Random number generator - CustomDistributionOptions() constructors
-
Constructor Description CustomDistributionOptions(E[] values) Constructs a custom empirical distribution from an array with occurrences. The number of value occurrences defines the weight of the value.
values — Non-empty array of values (values can repeat and be unsorted)CustomDistributionOptions(E[] values, Random random) The same as CustomDistributionOptions(E[] values), but enables using a custom random number generator.
values — Non-empty array of values (values can repeat and be unsorted)
random — Random number generatorCustomDistributionOptions(E[] values, double[] weights) Constructs a custom empirical distribution from arrays of values and weights.
values — Non-empty array with values (duplicate values are not allowed)
weights — Array of weights (same size as values, no negative weights)CustomDistributionOptions(E[] values, double[] weights, Random random) The same as CustomDistributionOptions(E[] values, double[] weights), but enables using a custom random number generator.
values — Non-empty array with values (duplicate values are not allowed)
weights — Array of weights (same size as values, no negative weights)
random — Random number generatorCustomDistributionOptions(Map<E, Double> valuesWeightsMap) Constructs a custom empirical distribution from the given map with values and weights.
valuesWeightsMap — Map with <value, weight> pairs (non-empty, no negative weights)CustomDistributionOptions(Map<E, Double> valuesWeightsMap, Random random) The same as CustomDistributionOptions(Map<E, Double> valuesWeightsMap), but enables using a custom random number generator.
valuesWeightsMap — Map with <value, weight> pairs (non-empty, no negative weights)
random — Random number generator
-
How can we improve this article?
-