


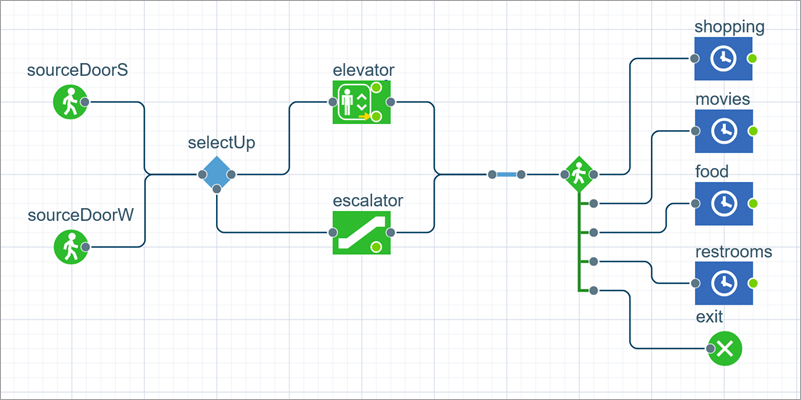
The flowchart approach is used to describe modeled processes as a sequence of blocks where each block represents a step that defines a separate operation.
To start creating a flowchart, add blocks from a palette to the graphical editor and connect them in the proper order. Typically, a flowchart starts with a block that generates agents, such as a  Source or
  PedSource block. To proceed, add blocks for the events that need to happen in your model and finish with an exit block, such as
  Sink or
  PedSink.
To create a flowchart
- From the Blocks section of the required library, drag a starting block into the graphical editor.
- Refer to the Blocks section of the library or, if you are using the Process Modeling Library, the Auxiliary section as well. Add blocks representing the next steps in the logic of your model. If placed in a straight line and close to each other, they will connect automatically.

-
As you build your chart, dynamic guides appear to help you align blocks.
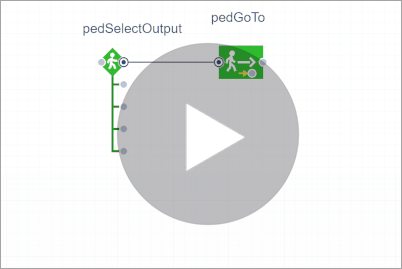
- To connect two blocks manually, click an output port of one block and the input port of another one, in any order. AnyLogic will draw the best-fitting connector automatically.
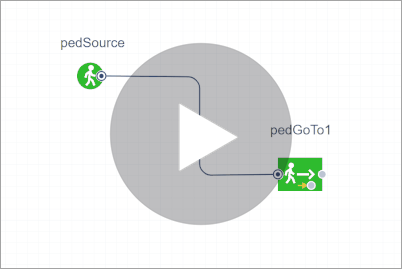
- You can also draw connectors manually. To do so, click the first port, then click wherever you need your connector to have a turning point. To finish, click the second port.
-
To turn your manually drawn connector into an automatically aligned one, right-click the connector and select Auto-align.
When you draw connectors, AnyLogic 9 aligns and adjusts them automatically by default. Manually drawn connectors can cross each other and other elements, making the chart appear tangled. Using auto-alignment gives you a clearer view of the layout.
To apply auto-alignment to a connector
- Right-click (macOS: Ctrl + click) the connector.
- In the context menu, select Auto-align.
To rearrange the blocks
- Move the necessary blocks by dragging. As you drag a block, dynamic guides will suggest where you can drop it to form a straight line with existing blocks. The connectors will realign automatically.
- To keep your flowchart tidy, use the dynamic guides that appear while you drag a block. They indicate where to place the block so it aligns with the existing ones.
To reshape the connectors
- To add a new turning point, double-click the connector at the necessary place, regardless of whether the connector is selected.
-
To move an existing turning point, select the connector, then drag the point.
-
By default, connector segments are either horizontal or vertical. To add an oblique segment, press Shift and draw at the desired angle.

- To delete a turning point, double-click its location, regardless of whether the connector is selected.
-
How can we improve this article?
-