


All available palettes are displayed below the button when collapsed. When expanded, the palettes are displayed to the right of the Projects view.
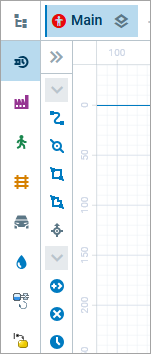 Sidebar with palettes and project tree buttons
To open a palette
- Click the palette’s icon. The minimized Palette view appears, with only element icons visible.
To toggle expand/collapse
- To expand the Palette view and see the element names, click .
- To return to the minimized view, click .
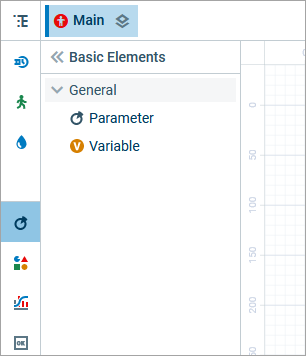 Expanded Process Modeling Library palette
The following palettes are available in AnyLogic 9:
 Process Modeling Library — Allows you to model processes in the form of flowcharts — a common graphical representation used in many fields such as manufacturing, call centers, logistics or healthcare.
  Material Handling Library — Allows you to model manufacturing operations, complex production workflows, and storage facilities.
 Pedestrian Library — Provides elements for simulating pedestrian flows in spaces like buildings or streets.
 Rail Library — Contains elements that let you build rail yards and rail transportation.
 Road Traffic Library — Includes elements for modeling vehicle traffic.
 Fluid Library — Allows you to model storage and transfer of fluids and bulk cargo.
 System Dynamics — Contains elements for building stock and flow diagrams and decision rules, including subscripts.
 Statechart — Allows you to model more sophisticated behavior that cannot be defined using events and dynamic events.
 Basic Elements — Contains elements used to define the logical structure of the model.
 Presentation — Contains geometric shapes and various elements that you can use to draw presentations and animations for your models.
 Space Markup — Contains various space markup elements, such as paths, nodes, attractors, and library-specific elements.
 Analysis — Contains charts, data sets, and other elements that you can use to collect and visualize the data generated by the model.
 Controls — Contains controls that make the model interactive, such as buttons and sliders.
 Connectivity — Contains tools for integrating data sources, such as text files and Excel files.
 2D Pictures — Various 2D images that you can use to represent the elements of your models.
 3D Objects — Various 3D objects of people, machines, and buildings that you can use to represent the elements of your models.
-
How can we improve this article?
-