


In the first phase, we created the model simulating a simple pedestrian flow: passengers enter the subway entrance building and then move to the trains through the hall.
Now we want passengers to pass through the fare gates before entering the subway platform. So let’s add fare gates at the end of the hall.
Fare gates are a typical example of services used in pedestrian models.
There are two types of space markup shapes you may use to draw services in your pedestrian model:
-
 Service With Lines — defines a service with a queue where pedestrians wait in a queue line until the service becomes available.
-
 Service With Area — defines services with electronic queue.
Pedestrians in this case do not stand in lines, but wait in the adjacent area.
Service With Area — defines services with electronic queue.
Pedestrians in this case do not stand in lines, but wait in the adjacent area.
Fare gates are naturally represented by the Service with Lines element.
Draw the fare gates
-
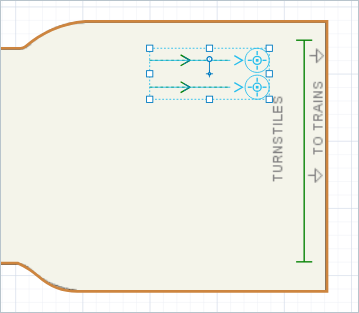
Drag the Service With Lines element from the Space Markup section of the
 Pedestrian Library palette onto the graphical editor.
You will see two service points and two queue lines leading to these points. Place the shapes as shown in the figure below:
Pedestrian Library palette onto the graphical editor.
You will see two service points and two queue lines leading to these points. Place the shapes as shown in the figure below:
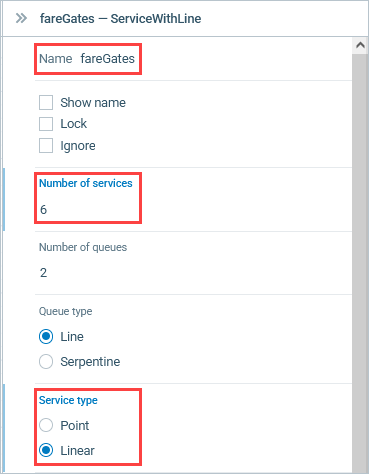
- Rename the added element to fareGates.
- It is obvious that having two fare gates is not enough. We will increase the number of fare gates by setting the Number of services and Number of queues parameters to 6.
-
Now change the Type of service parameter value from Point to Linear.
This will make pedestrians enter the service at the start point of the line and then move to the end point before leaving the service.
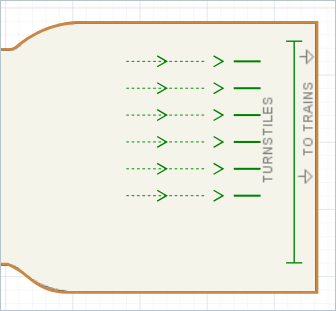
Eventually we will have the following setup of fare gates:
Now we will modify the model flowchart.
We will add the ![]() PedService block to the flowchart.
This block simulates how pedestrians go to the services defined graphically with the markup shape, and get serviced there.
PedService block to the flowchart.
This block simulates how pedestrians go to the services defined graphically with the markup shape, and get serviced there.
Modify the model flowchart
-
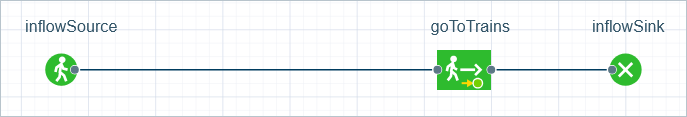
Prepare the place for the new block in our flowchart.
Move the goToTrains and inflowSink blocks to the right as shown below:
-
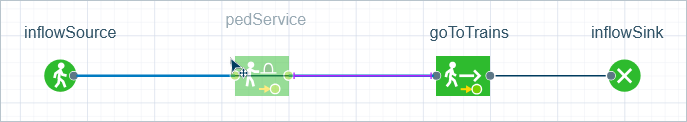
Now drag the
 PedService block from the
Pedestrian Library palette onto the graphical diagram, and place it right after the
inflowSource block.
Once you hover the block over the connector line, the ports will be automatically connected.
The right port of the PedService block should become
connected, not the lower port of the block.
PedService block from the
Pedestrian Library palette onto the graphical diagram, and place it right after the
inflowSource block.
Once you hover the block over the connector line, the ports will be automatically connected.
The right port of the PedService block should become
connected, not the lower port of the block.
-
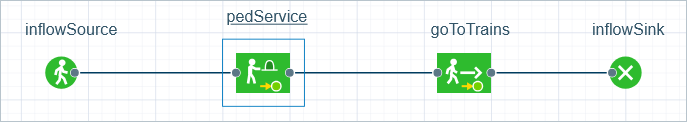
Now PedService will appear in the flowchart, connected automatically.
Configure the flowchart blocks
-
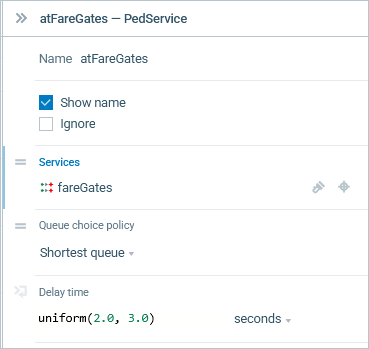
Open the Properties of the PedService block.
- Rename the block to atFareGates.
-
Choose fareGates (the name of our Service With Lines markup shape) as the Services.
-
You can see that the Delay time is uniformly distributed with minimum value of 2 seconds and maximum value of 3 seconds.
Leave it since it is typical delay time for fare gates.
We have defined the new logic, and now we can run the model and observe its behavior.
Build the model by clicking the  Build model toolbar button.
If the model contains errors, the errors view will appear with a list of errors.
Double-click an error item to open the properties of the problematic element and center it on the graphical editor.
Build model toolbar button.
If the model contains errors, the errors view will appear with a list of errors.
Double-click an error item to open the properties of the problematic element and center it on the graphical editor.
After the model is successfully built, you can start it. By running the simulation, you automatically bring the current model up to date.
Run the model
-
Run the model. You can see that now passengers pass through fare gates and the lines get very long.
To avoid long queues we should increase the number of fare gates.
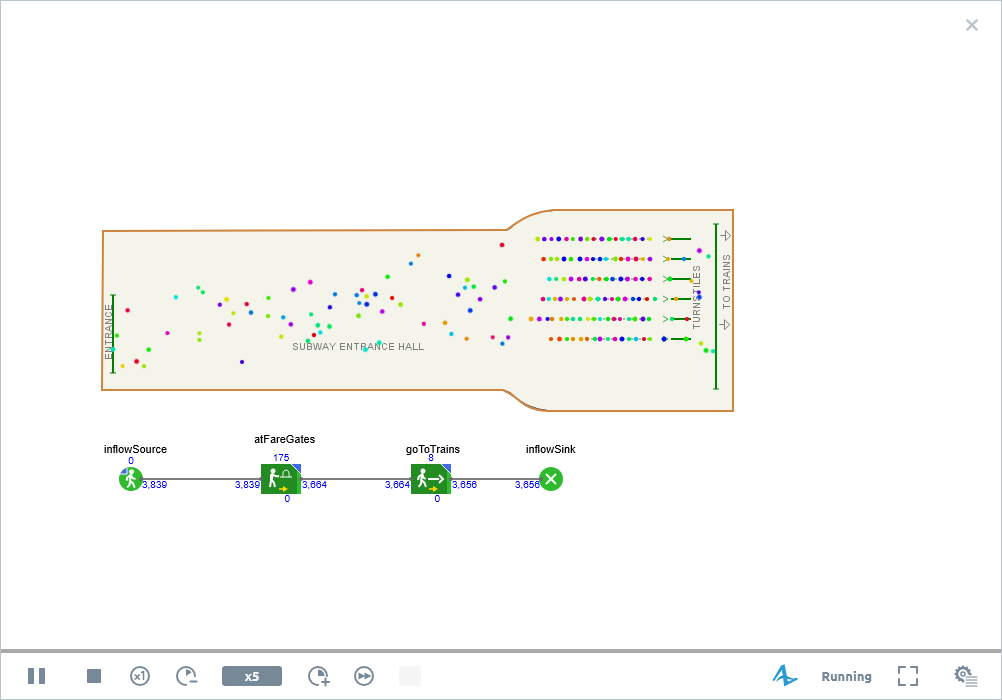 6 fare gates. Terrible lines.
 - Stop the model, open the properties of the service shape again, then increase the number of fare gates by setting the Number of services and Number of queues parameters to 7.
Run the model again and see how the things are going now. You may think that everything is fine. But the thing is the simulation speed is rather slow. To understand the global trend, we should increase the simulation speed.
You can adjust the execution speed using the
 Slow down and
  Speed up controls.
Right now, it is better to switch to virtual time mode to view simulation run at its maximum speed and simulate a long period of time.
To enable virtual time mode click the Run as fast as possible (virtual time mode)
Speed up controls.
Right now, it is better to switch to virtual time mode to view simulation run at its maximum speed and simulate a long period of time.
To enable virtual time mode click the Run as fast as possible (virtual time mode)  control.
Simulating a long period of time gives us the answer. Lines are still growing, not as fast as before, but they do become rather significant. So... 7 fare gates are still not enough to service 5000 pedestrians per hour.
Let’s increase the number of fare gates once again. Change the number of services and number of queues to 8 and run the model again.
Finally, we have reached the acceptable level of service — the station can successfully cope with this pedestrian flow.
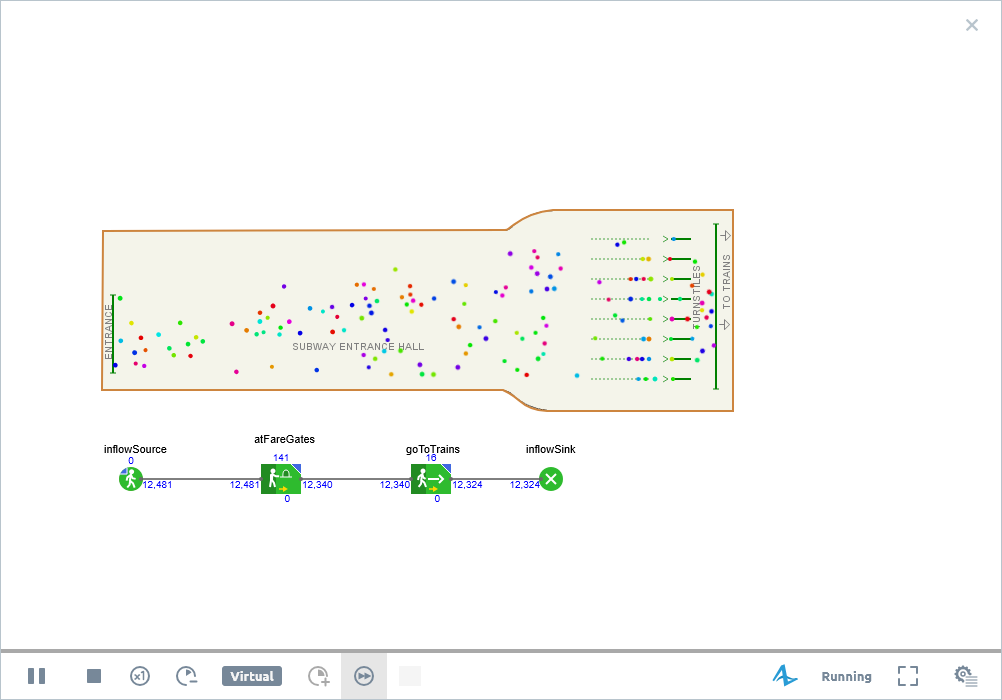 8 fare gates. Queues are reasonable.
We made the first practical use of our model.
This model helped us find the required number of the service points.
You can fiddle around with the pedestrian arrival rates in the settings of the ![]() PedSource
block, and analyze how to improve the facilities to cope with the adjusted load.
PedSource
block, and analyze how to improve the facilities to cope with the adjusted load.
Let us move on to the next phase
Demo model: Subway Entrance Hall — Phase 2 Open the model page in AnyLogic Cloud. There you can run the model or download it (by clicking Model source files). Demo model: Subway Entrance Hall — Phase 2Open the model in your AnyLogic desktop installation.-
How can we improve this article?
-